$ES $SPX #ES-mini futures #trading setup #Daily
On Thursday bulls broke out over the red supply zone:
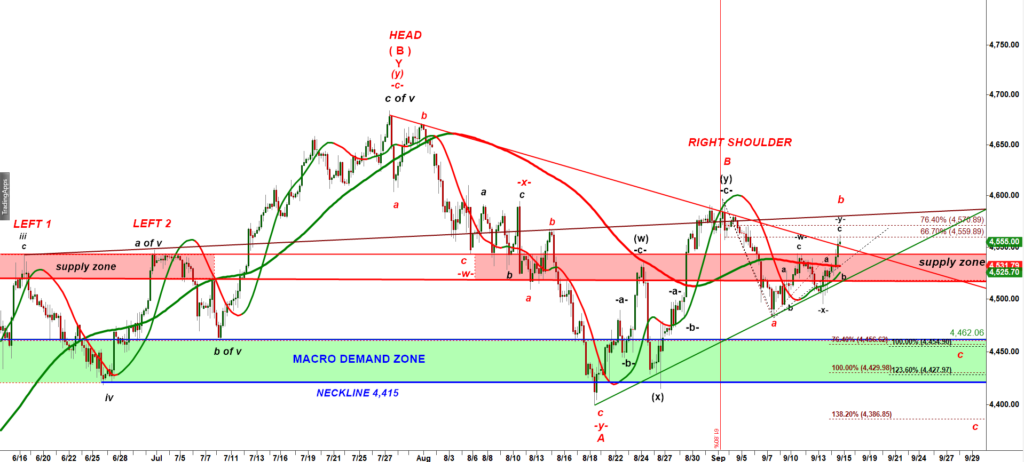
So far that move up looks like a clean corrective three wave up structure we count as w-x-y.
But if bulls push over 4,560 that bearish scenario will most likely get invalidated…
To get back in play bears need to push ES back under 4,540, the upper edge of the Red supply zone AND the high of the previous swing up labelled -w- up.
My main problem is that I do not see a clean alternative micro bullish path leading to a new high of 2023 year. Let me explain why below:
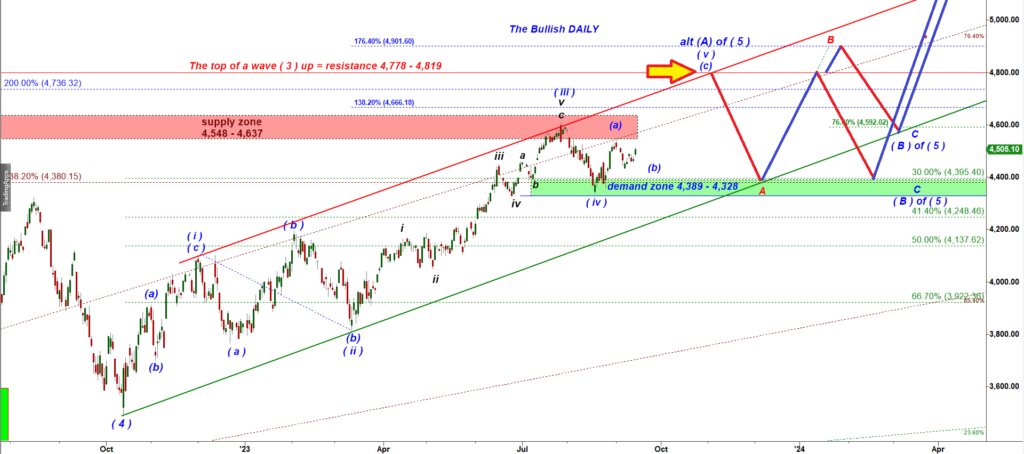
The bullish macro scenario is that S&P has been moving up in a five wave up structure off the Oct’22 low.
However, the move up off the mid Aug’23 low does not really fit that wave count. Under that count, the move up off the mid Aug low was supposed to come as a very strong rally that was supposed to push ES quickly up to the July high in a subwave (a) of wave ( v ) up. However, we got some weak a-b-c up bounce that managed to erase only 2/3 of the wave (iv) down. Again, the textbook subwave (a) of wave ( v ) up tends to make a double top retesing the high made by wave ( iii ) up = 4,607. Under that bullish count the ultimate target for this rally in a wave (v) up is the Jan’22 high = 4,819. The wave (v) up is supposed to be structured as (a) up, (b) down, (c) up structure.
Can price keep pushing higher without following any wave structure? Sure, it can!
But the main idea behind wave trading is that we base our trades on proven trading setups that are based on some repeating pattern.
I need a flat a-b-c consolidation to consider a macro long setup:
This is how it could play out:
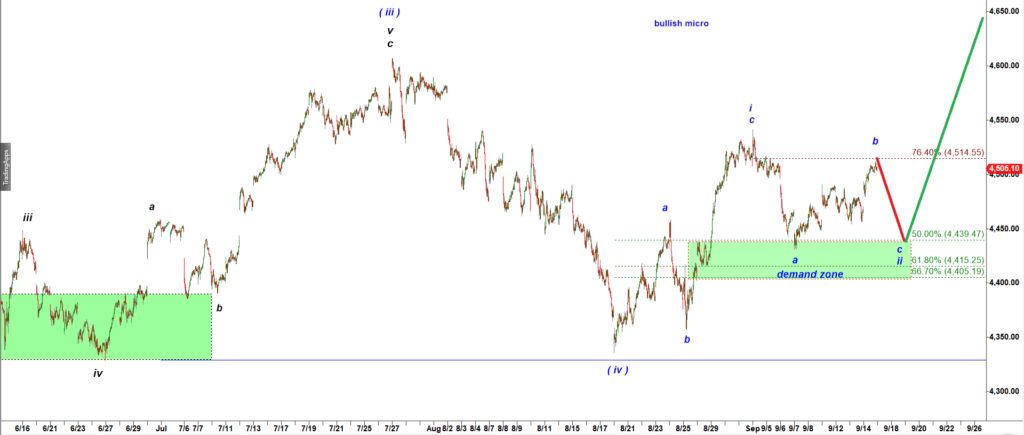
I can not say I am sure that we are going to get that drop. But such a drop would make a recognizable pattern that proved its reliability in the past.