$Es #ES-mini #trading setup #Elliott Wave #trading strategy
We have got a bounce to the lower edge of a Red supply zone:
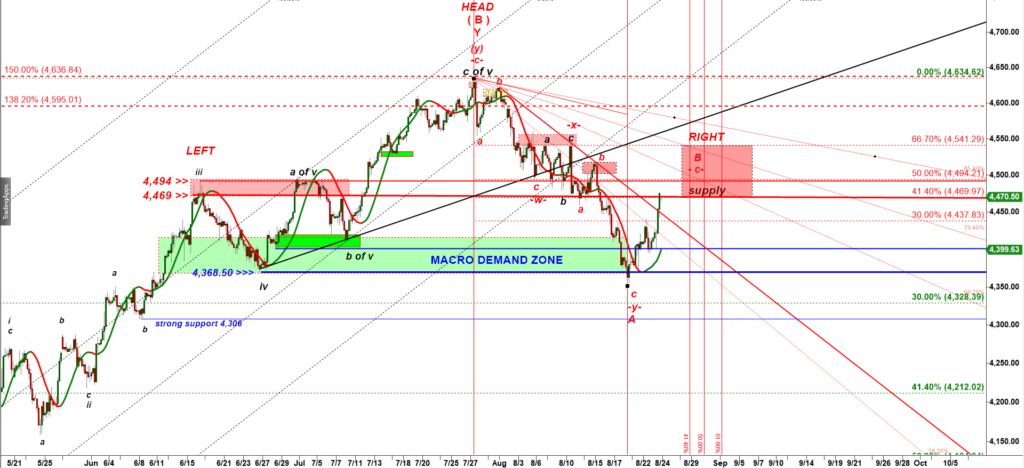
That supply zone stopped two strong rallies in June and July 2023.
Moreover, that move up looks like the right shoulder of the bearish reversal head and shoulders pattern, recognized by millions of traders. But I see that the left shoulder was formed by a double peak. Because the market loves symmetry we may get something like that in the right shoulder.
Now let’s zoom to a 15 in micro chart in to see the micro structure of this rally:
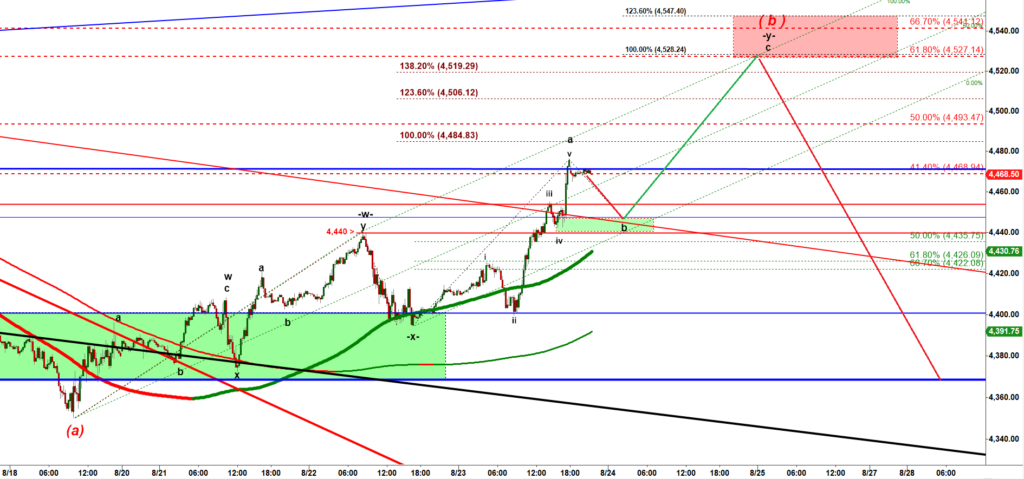
Yes, this rally has hit the lower edge of the red supply zone. But I can not find a wave count that can be considered completed here. Note two pullbacks labeled as x and -x- down. They lacked the textbook a-b-internal structure. That is a sign we deal with a double three corrective structure, a structure that is composed of two -a-b-c- up moves interconnected by a wave -x- down. That means that off the low labeled as -x- down we should expect at least an -a- up, -b- down, -c- up structure.
You may remember that I explained last week that a bearish w-x-y corrective structure gets completed with an emotional capitulation:
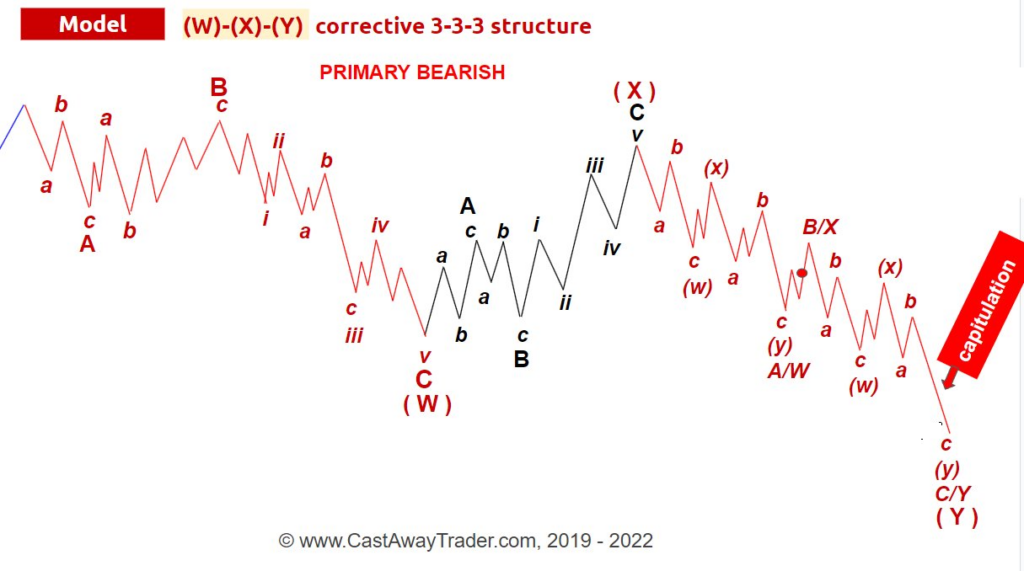
A corrective bullish -w-x-y- bounce may top with a similar acceleration in subwave c of wave -y- up that becomes a powerful bulls’ trap. That acceleration makes bulls believe that they deal with a wave iii up that after a pullback in a wave iv down will be followed by another push to a higher high in a wave v up. The trick is that the w-x-y structure gets completed when the bullish momentum reaches its peak.
At this point the breakout line at 4,440 is the key support for bulls. As long as they hold ES over that level they can produce another strong leg up.
Let’s switch back to a 240 min chart:
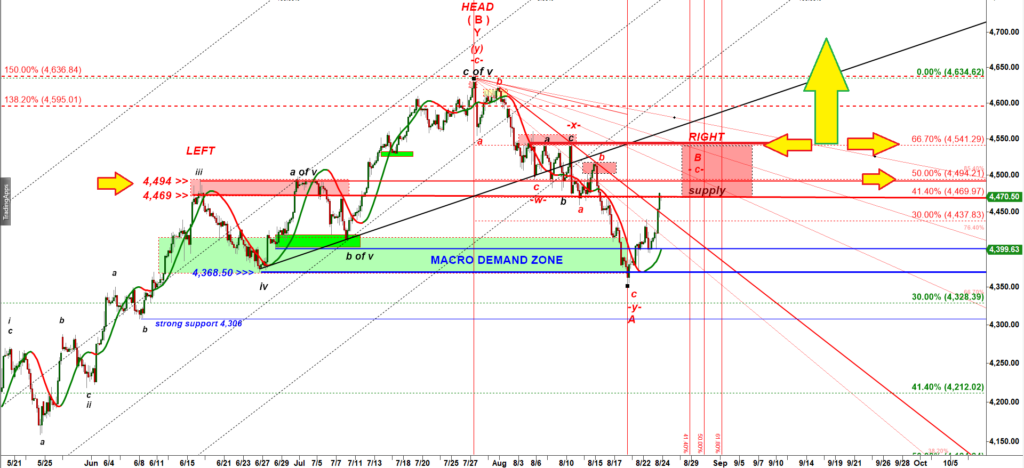
The critical macro resistance, the key line dividing a corrective bounce from a new rally is a 66.7% retracement = 4,541. If bulls manage to push ES over that level then chances are ES is heading to a new higher high of 2023.
A very strong resistance is 4,494. Not only that is the upper edge of the Red supply zone that stopped two big rallies in 2023, but it also a widely watched 50% retracement fib.
BONUS:
Let’s play with Gann’s levels:
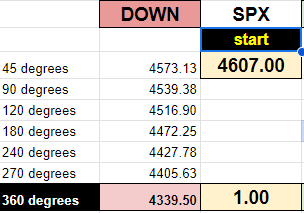
360 degrees down off the top is 4,339.50.
S&P bottomed at 4,335 last week!
Look at 180 degrees down off the top = 4,472.25.
Interestingly, 4,474 is where a 50% retracement of the August decline is located!
You can subscribe to my Gann’s Levels indicator for TradingView that calculates those levels automatically.