$NQ #NQ-mini #trading setup #Elliott Wave
On August 17th I noted that the minimum bullish expectation was a rally to the Red Box on a Daily chart with the lower edge at 15,318.
On August 22 I talked about a bearish Head and Shoulders reversal shown on the 240 min chart below:
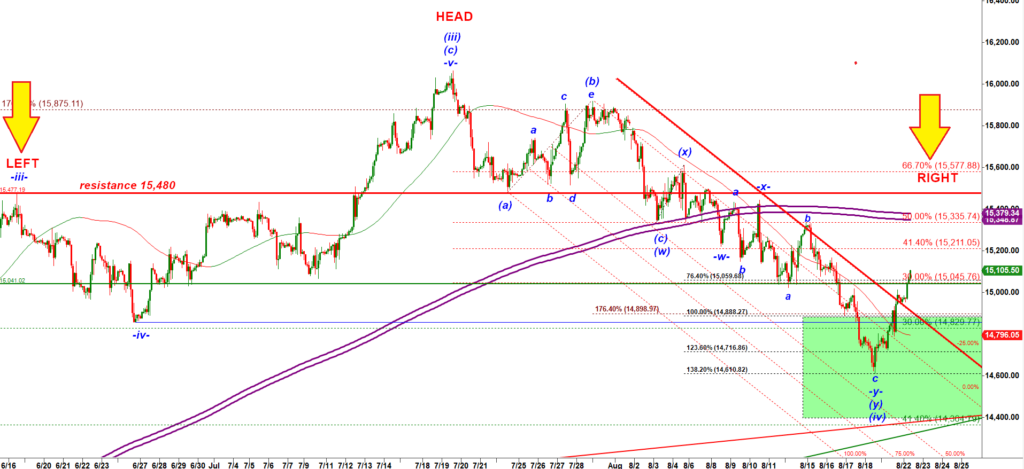
I noted that the bearish scenario argues for a corrective rally targeting 15,480 to draw the Right Shoulder of a bearish reversal Head and Shoulders pattern. This is how that 240 min chart looks like now:
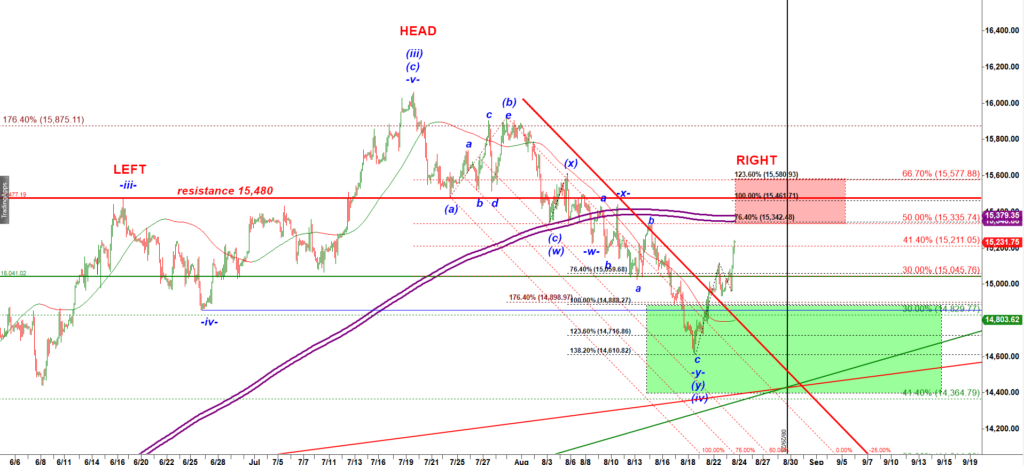
Looking at the 240 min chart above we can see that this rally has NOT tagged the main resistance at 15,480 (the thick red horizontal line).
However, if we zoom-in to a 15 min chart w can see that the rally has been following a corrective triple three structure:
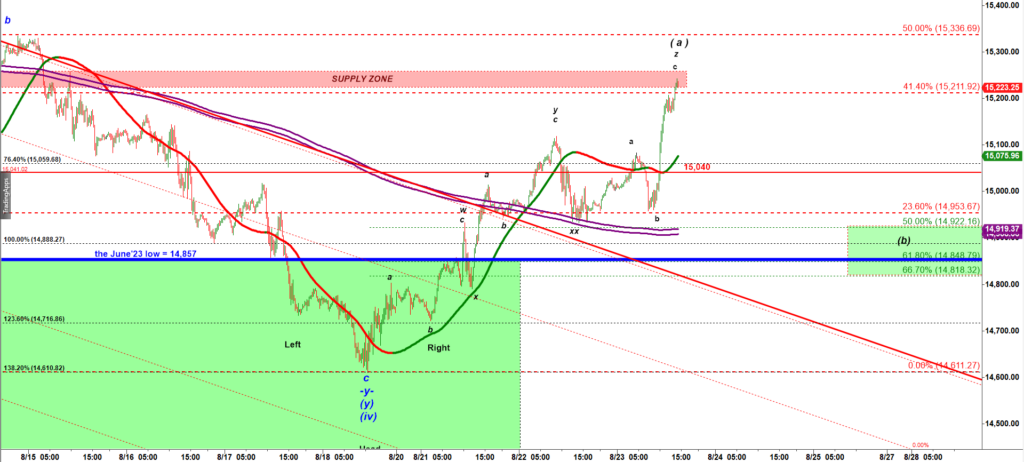
It is possible that this move up was only a subwave (a) up to be followed by a deep corrective pullback in a wave (b) down to be followed by the final push higher in a wave (c) up to the target 15,480 – 15,577 (most likely in early September).
What I mean is that for bears the ideal scenario will be to get an -a- up, -b- down, -c- up structure into the target / resistance around 15,480 drawing the Right Shoulder.