$ES: Macro Update: The 2023 Rally Looks Having Topped

  • CastAwayTrader
  • August 13, 2023
<<< Back to All Updates
<<< Macro Updates

$ES #ES-mini #trading setup #trading futures #Elliott Wave

My primary macro scenario assumes that the rally off the 2009 low topped in Jan 2022:

ES-mini monthly chart

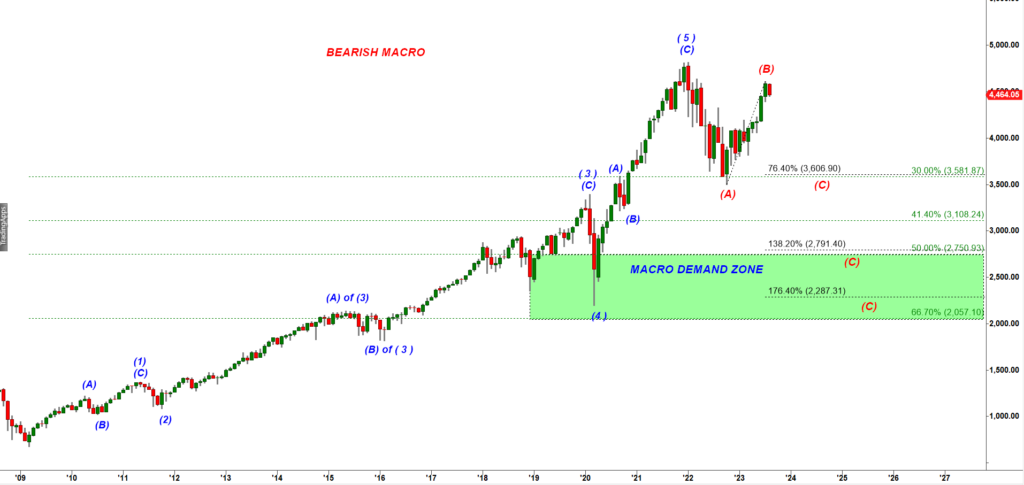
Then we should expect a large (A)-(B)-(C) down corrective move. The 2022 decline that bottomed in Oct 2022 can be counted as a wave (A) down and the rally that followed can be counted as a corrective wave (B) up. If the 2023 rally topped in late July then we are watching start of a large leg down in a wave (C) down.

There are two tight clusters of fibs that can work as magnets/support levels for the second leg down in a wave (C).

Target / Macro Magnet 1 = 3,600. It is formed by a 76.4% ext of wave (A) down and a 30% retracement of the whole rally off teh 2009 low.

Target / Macro Magnet 2 = 2,790 – 2,750. It is formed by a 138.2% ext of wave (A) down and a 50% retracement of the whole rally off the 2009 low.

Can we be sure that the 2023 rally in a wave (B) up has topped?

Let’s switch to a Daily chart of ES-mini futures:

ES-mini Daily

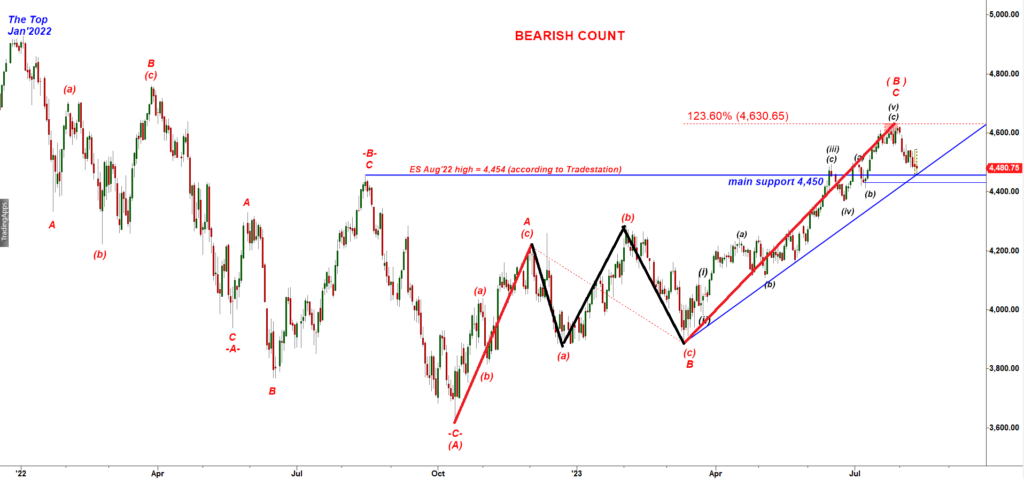
The key distinguishing feature of any corrective wave B is a three wave structure:

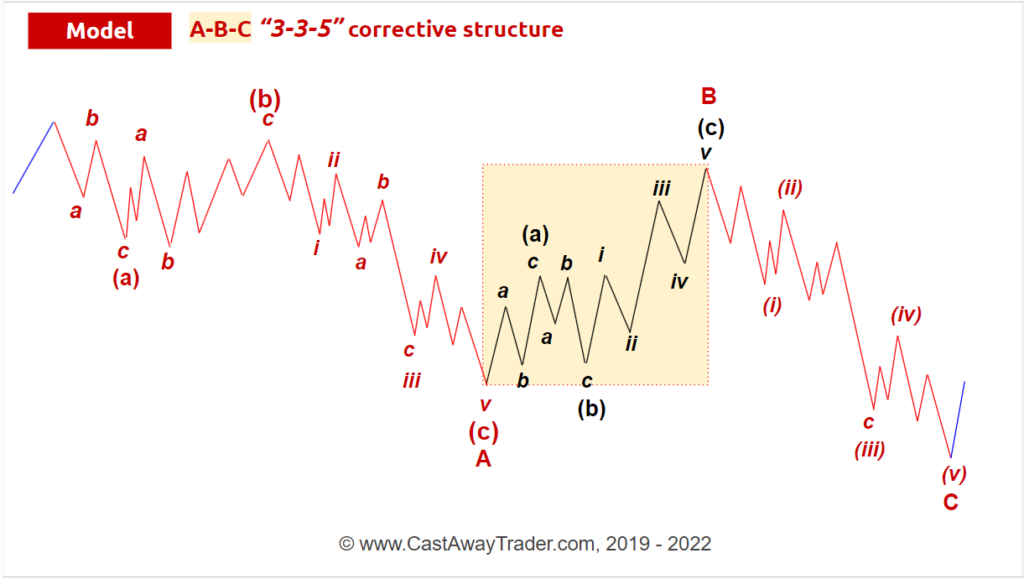
Consider the Elliott Wave theory as a collection of repeating patterns. You can always refer to the models, graphic visualization of those patterns.

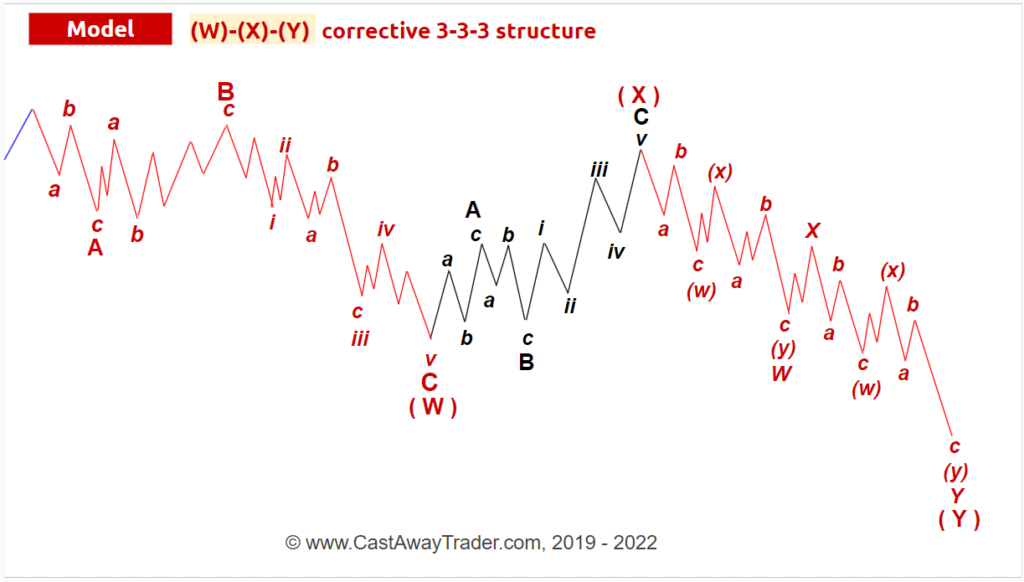
There are two slight variations of that repeating fractal depending on a micro structure of the second leg down:

As you can see, the 2023 rally neatly followed the part of the model highlighted with the yellow rectangle (see the first model chart shown above). And you can see what normally happens when a corrective pullback in a wave B up tops out, we get the second leg down in a wave C down.

The second leg down may have a clean five wave down micro structure but in the majority of cases it would have a more complex three wave W-X-Y down structure (as shown above).

You can enroll into my video course that explains in details all the repeating patterns identified by the Harmonic Elliott Wave theory.

Let’s come back to the Daily chart:

ES-mini daily chart

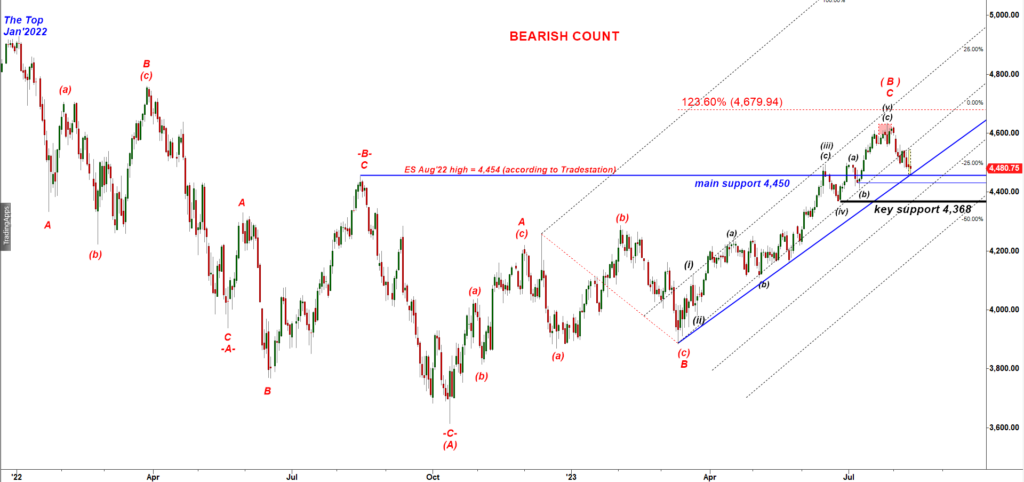
The rule is “upon completion of a five wave up structure the low made by a pullback in a wave (iv) down works both as a magnet for the first pullback and a strong support”.

Therefore, the macro target 1 for the first (a)-(b)-(c) move down is 4,368, the low made by a micro wave (iv) down on June 26th, 2023.

If we get an a-b-c- down structure testing that support that would keep possibility for another rally after that pullback. If, in contrast, we will see extension of that decline without large pullbacks that would be a strong argument in favor of the macro bearish scenario where ES-mini completed the corrective wave (B) up in June 2023.

I explained those two scenarios in my previous macro update based on S&P cash index charts:

S&P Cash Index, Weekly chart

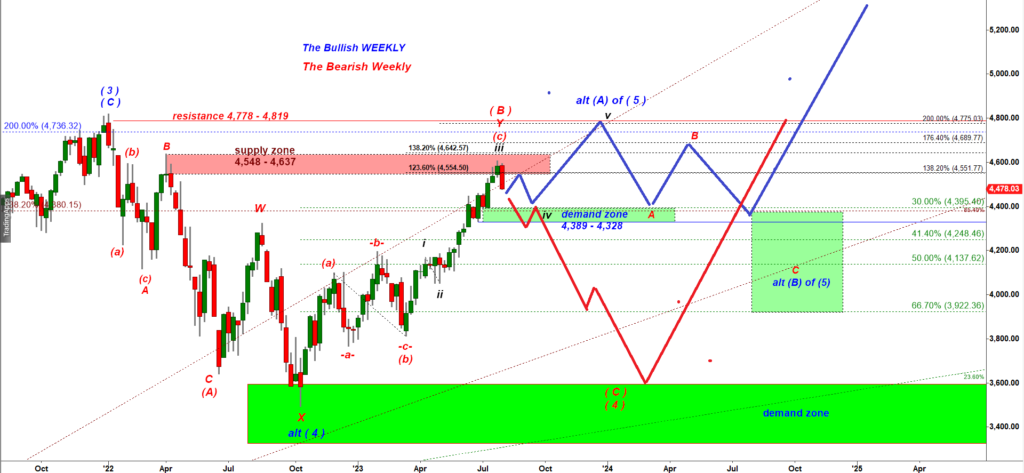
We keep watching two macro path, the bullish blue and the bearish red ones:

“…Under the blue bullish path an a-b-c move down to that green demand zone would be stopped by bulls and we would get another large move down targeting the Jan 2022 high. Under the red bearish path price would most likely drops down in a straight line fashion, violate 4,328 support and then after a brief consolidation would continue going down in a strong decline of a subwave (C) of wave (4)down targeting 3,600.”

“The main idea is that I expect price to test 4,400 main support in either of those two scenarios, the bullish and the bearish. If we get an a-b-c move down to that Strong Demand Zone that would be a great buying opportunity. In contrast, if we get a strong impulsive looking drop down to that area and ES-mini undercuts briefly 4,369 that drop would most likely confirm ES made a major top and started a large move down in the red wave (C) of (4) down shown above.”

I will post one more micro update tonight…

Subscribe to Free Updates

Get Unlimited Access

PrevPrevious$NQ: Bullish Macro Scenario: A Bullish Bounce is Coming
Next$NQ – Bulls Have a Setup To Test 15,300 ResistanceNext

More To Explore

$ES: Bulls Built a Base and Started a Rally

$ES #ES #trading setup #Elliott Wave We got a corrective three wave decline that almost hit the Green Box: ES-mini

CastAwayTrader June 20, 2025

$ES: Leaking Down to a 80 Day Trough As Expected

$ES #ES-mini #Elliott Wave Today the US stock market is closed. Let’s review the overnight decline in ES-mini futures. ES

CastAwayTrader June 19, 2025

Important Disclaimer

CastAway Trader LLC, the publisher of this web-site and videos is not registered as an investment adviser nor a broker/dealer with either the U. S. Securities & Exchange Commission or any state securities regulatory authority. Users of the website www.castawaytrader.com and viewers of the videos are advised that all information presented on the website is solely for informational purposes, is not intended to be used as a personalized investment recommendation, and is not attuned to any specific portfolio or to any user’s particular investment needs or objectives.

Trading stocks, options, or futures carries a high level of risk, and may not be suitable for all investors. Before deciding to trade, you should carefully consider your objectives, financial situation, needs and level of experience. CastAway Trader LLC provides general overview of trading methods that does not take into account your objectives, financial situation or needs. The content of this website must not be construed as personal advice. All trading setups and/or trades presented in the web site and/or trading chat room by CastAway Trader an/or by other members of the chat should be considered hypothetical for educational purposes only and should not be expected to be replicated in a live trading account.

An investor could potentially lose all or more than the initial investment. You should not speculate with capital that you cannot afford to lose. Only risk capital should be used for trading and only those with sufficient risk capital should consider trading. Risk capital is money that can be lost without jeopardizing ones’ financial security or life style.

You should be aware of all the risks associated with trading. You should seek advice from an independent financial advisor.

Any information posted on this web site is not to be construed as an offer to sell or the solicitation of an offer to buy, nor is it to be construed as a recommendation to buy, hold or sell (short or otherwise) any security. All users of the website must determine for themselves what specific investments to make or not make and are urged to consult with their own independent financial advisors with respect to any investment decision. The reader bears responsibility for his/her own investment research and decisions, should seek the advice of a qualified securities professional before making any investment, and investigate and fully understand any and all risks before investing. All opinions, analyses and information posted on the website are based on sources believed to be reliable and written in good faith, but should be independently verified, and no representation or warranty of any kind, express or implied, is made, including but not limited to any representation or warranty concerning accuracy, completeness, correctness, timeliness or appropriateness. In addition, CastAwayTrader LLC and its officers and employees undertake no responsibility to notify such opinions, analyses or information or to keep such opinions, analyses or information current. Also be aware that the owners, officers and employees of the web site www.castawaytrader.com may have long or short positions in securities that may be discussed on the website, Premium Trading Chat room and/or in the videos posted by CastAway Trader LLC.

Past results are not indicative of future profits.

Subscribe to Free Updates

Get Unlimited Access