$ES #ES-mini #trading setup #Month Opening Range
ES has been unusually calm in a sense that it spent 95% of the tiem inside month opening ranges since the beginning of February:
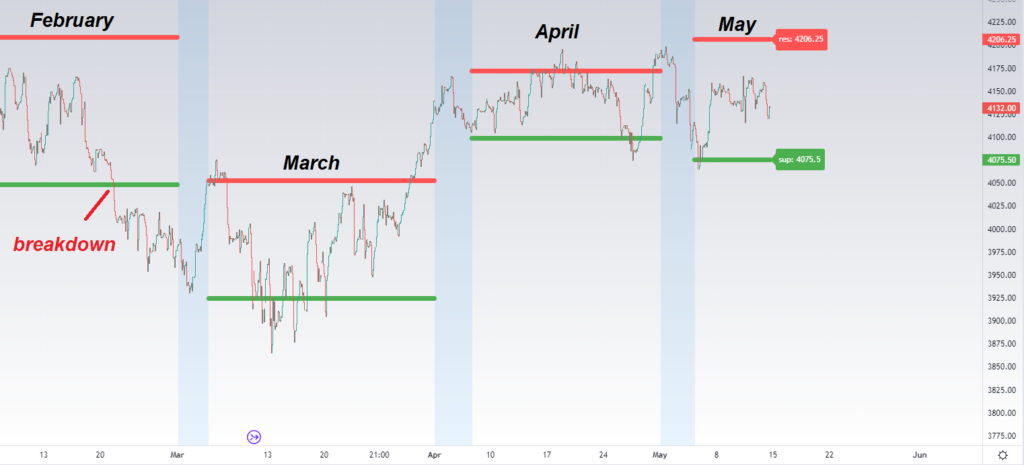
According to the Month Opening Range strategy a failed breakdown under the Monthly Support is normally followed by a rally targeting the Monthly Resistance:
You can add this free TradingView indicator to your toolbox here.
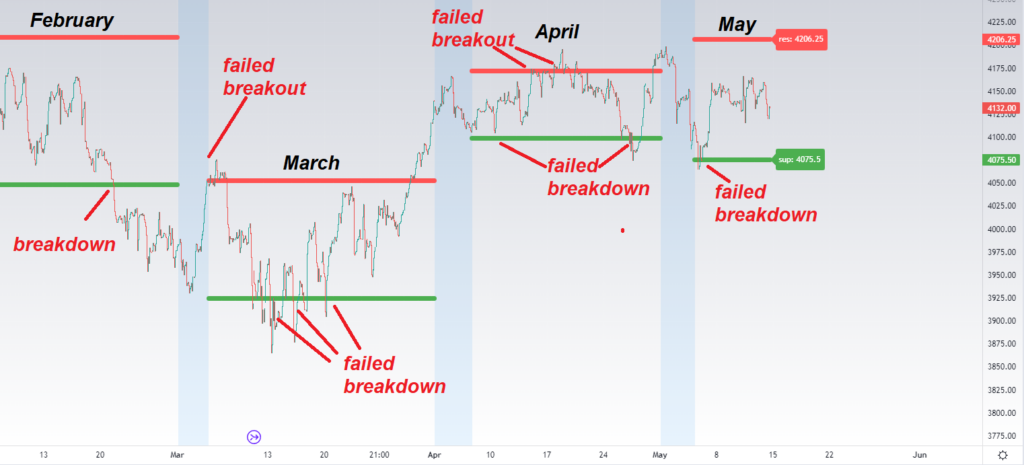
A failed breakout over the Monthly Resistance at the beginning of March was followed by a quick drop to the Monthly Support. Four attempts to break under the February monthly support were followed by a quick rally back up to the red monthly resistance. February 2023 was an example of another repeating pattern: price tends to reach high or down extreme in the middle of a month and then change its course. Note that bear failed to break under the monthly support at the beginning of a month. That failure was followed by a rally up to the Monthly Resistance. Failed breakout over the monthly resistance happened in the middle of April 2023!
What happened then? Price changed its course and quickly dropped down to the Monthly support. Finally, bears failed to break under the May monthly support at the beginning of this month.
According to the Monthly Opening Range strategy bulls can push ES-mini up to test the red Monthly resistance. But if bulls fail to break over 4,206 in the middle of this month that could become an important peak and price may turn down and start another leg down towards the green monthky support 4,075.
Now let’s look at alternative wave counts.
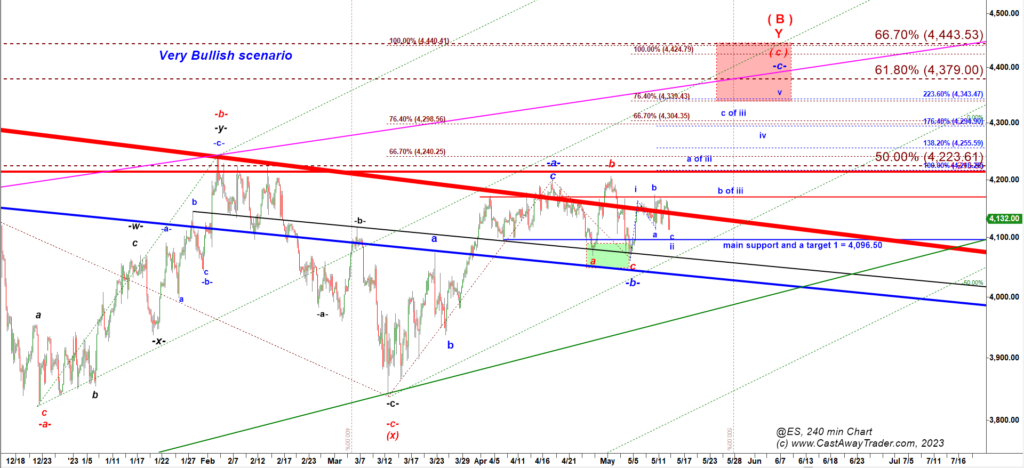
(1) The Very bullish Scenario:
Let’s zoom-in to a 60 min chart:
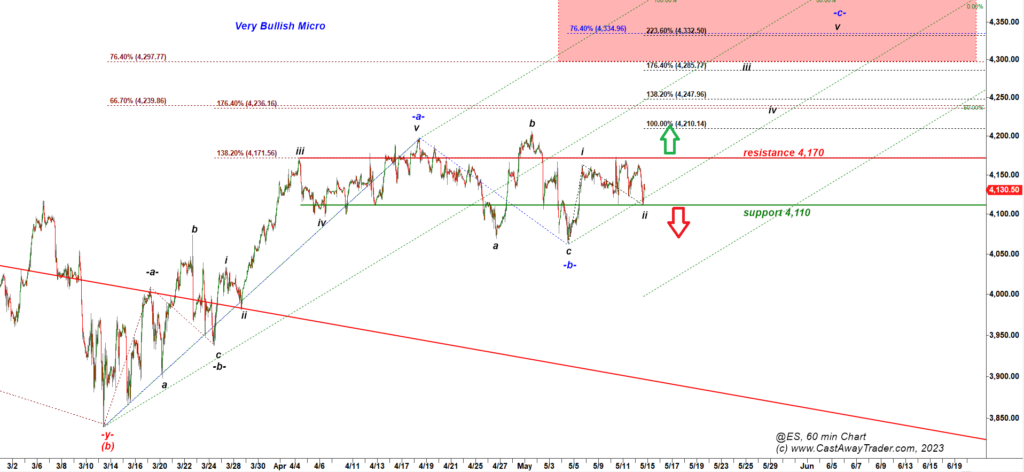
The congestion zone in between the resistance 4,170 and support 4,110 is a no-man’s land.
To trigger bullish scenarios bulls need to push ES over 4,170.
Conversely, break under 4,110 would look like a breakdown and will damage bullish counts if not completely invalidate them.
(2) The Less Bullish count:
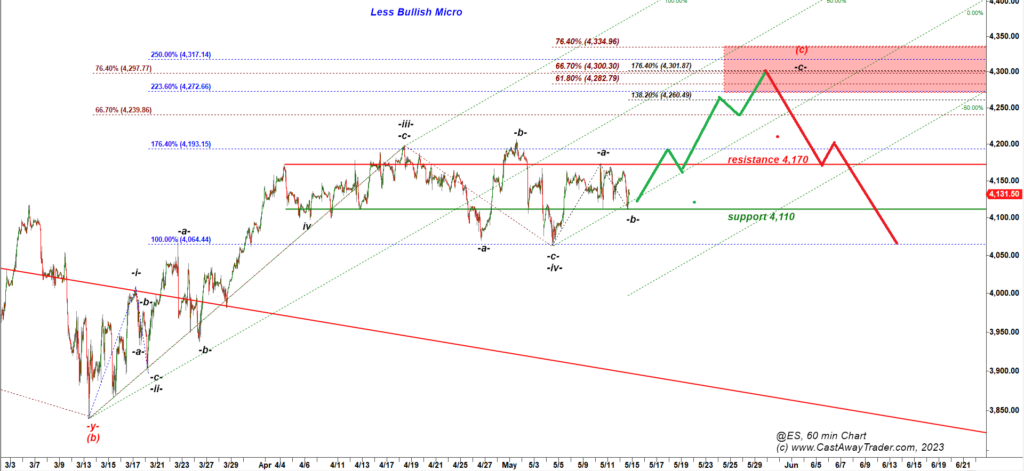
Under the less bullish count that current consolidation may be considered a subwave -b- down of a wave -v-up. That is a setup for another strong five wave up move in a subwave -c- of wave -v- up targeting 4,240 – 4,260 with potential extension up to 4,300.
(3) Bearish Diamond reversal pattern:
Above I noted:
“…break under 4,110 would look like a breakdown and will damage bullish counts if not completely invalidate them.“
The whole market is closely watching this bearish diamond reversal pattern:
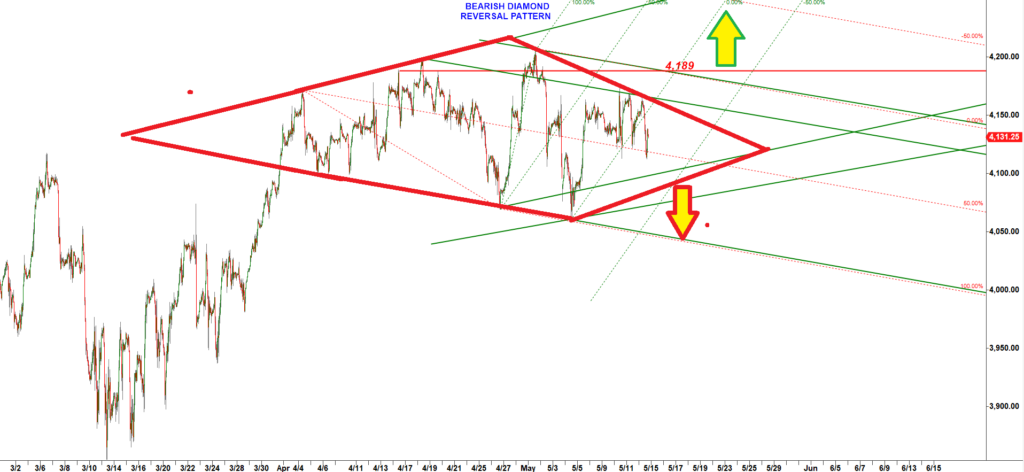
To trigger that pattern bears need to break under 4,075. But even in that case they will quickly hit a strong support at 4,035, the yearly resistance-turned-support.
As many of you know, I always prefer the least expected and the most painful scenarios for both camps, bulls and bears. The rule of thumb is “big moves come from failed moves”. The market almost always plays dirty and almost never does what the majority expects. This is why those “failed breakdowns” or “failed breakouts” reversal setups work so well!
What would catch off-guard millions of traders who watch that potential bearish diamond reversal pattern is a move over 4,190. That would invalidate the bearish diamond pattern and make bears chase the rally. Remember every big rally is driven by short covering.
For the macro bearish thesis the best scenario is to push ES over 4,200, drag bears up 40-60 points and make them not only cover shorts but also to flip long. This would set the stage for a setup what people often call the bulls’ trap.
A failed breakout of that magnitude would be followed by a strong 200-250 point drop down to 4,035. I think we have good chance for that scenario to unfold in June.