ES: At this a rally over 4,200 looks inevitable.

  • CastAwayTrader
  • April 30, 2023
<<< Back to All Updates
<<< Macro Updates

$ES #ES-mini #trading setup #Elliott Wave analysis

I think we have been dealing with a large corrective pullback off the October 2022 low.

Every corrective pullback normally has two legs.

The first leg in subwave (a) up or (w) up was structured as an -a-b-c- up structure.

ES-mini 240 min chart, October – December 2022

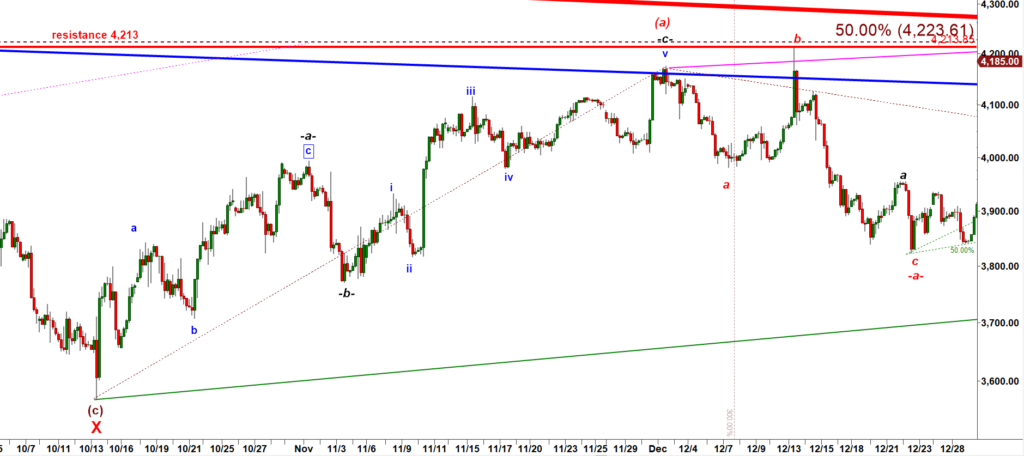
The first leg in subwave (a) up or (w) up was structured as an -a-b-c- up structure (see the chart above).

When we deal with corrective pullback unfortunately we can hardly predict if the second leg up will be shaped as a three wave or a five wave structure.

The second leg up in that (a) up, (b) down, (c) structure started in mid March 2023 when FED injected huge amount of liquidity in connection to the bank insolvency crisis in the USA:

ES-mini, 240 min chart

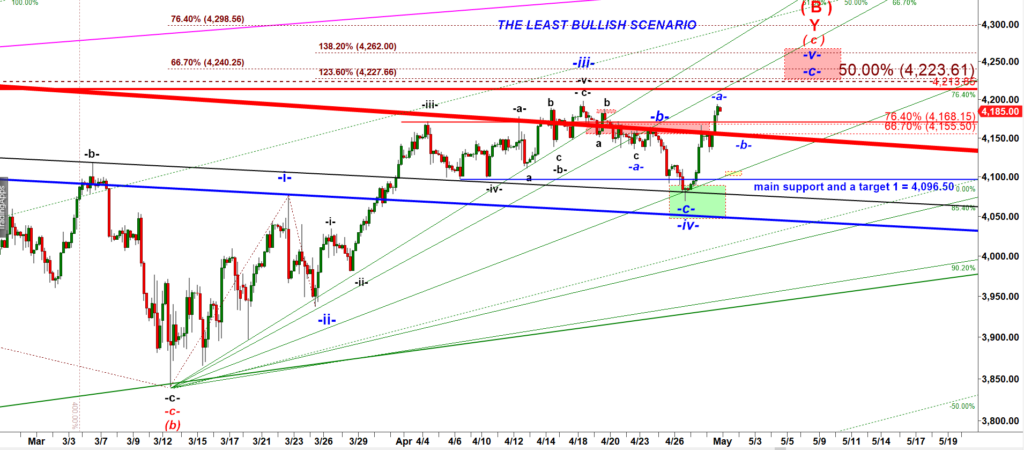
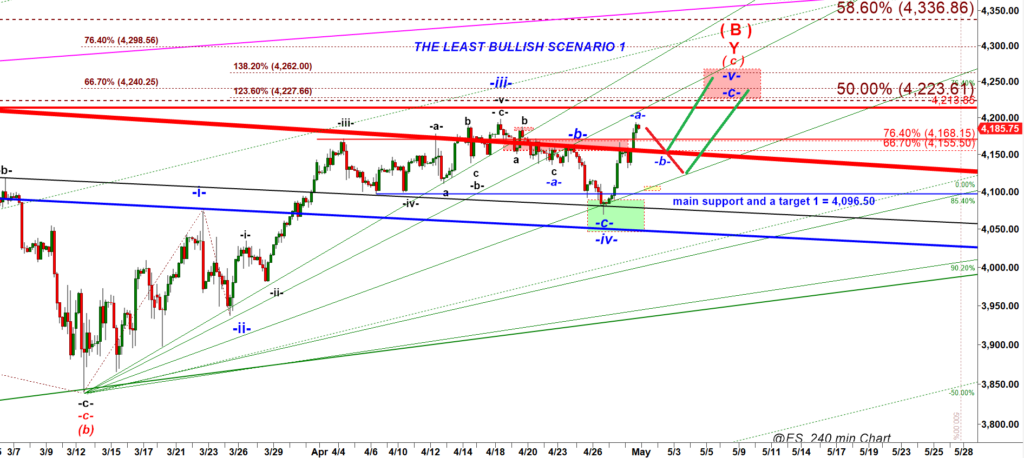
That chart above shows my primary Scenario (1) the Least Bullish Wave Count.

Under that scenario bulls have only one push left in a subwave -c- of wave -v- up that can stretch well over 4,200.

That Scenario (1) is based on two assumptions (i) that the second leg up that started in the middle of March 2023 would be structured as a five wave up and (ii) on the assumption that the wave -iii- up topped in early April.

Before I post two much more bullish scenarios 2 and 3 let me post again the structure of the first leg up off the October 2022 low:

ES-mini, 240 min chart October 2022

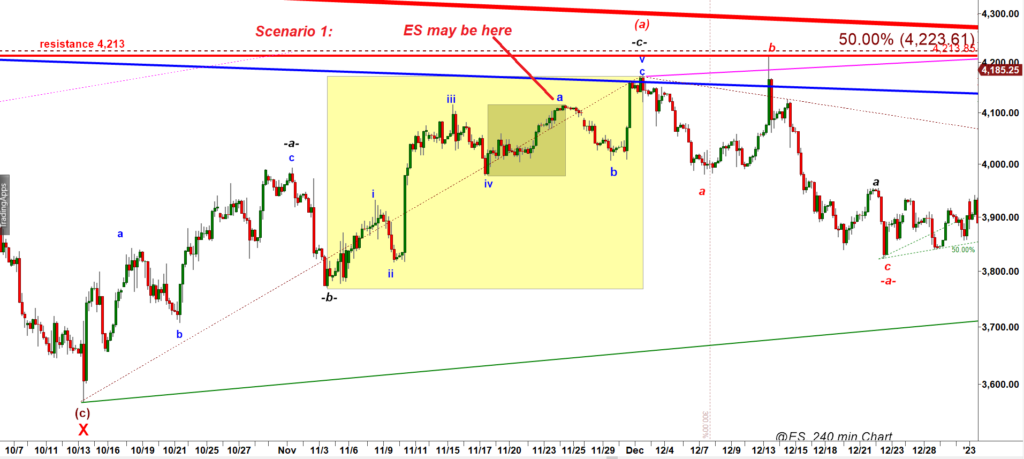
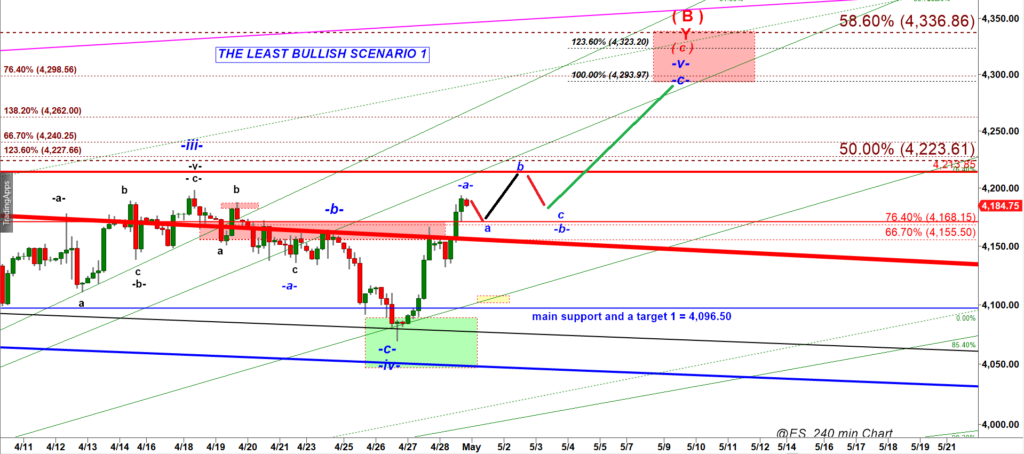
You can see a strong rally in a subwave a of wave v up that looks identical to the rally we got on Thursday.

The coming start of a month would be the ideal time to get a deep pullback in a subwave b down of wave v up, followed by a spike up in a subwave c of wave v up to 4,215 – 4,225, followed by a strong decline in a subwave a down to test 4,096 support once again (ideally undershooting it).

Scenario (2): the Most Bullish scenario: The five wave up structure where the micro wave -iii- up has not topped yet:

ES-mini, 240 min chart

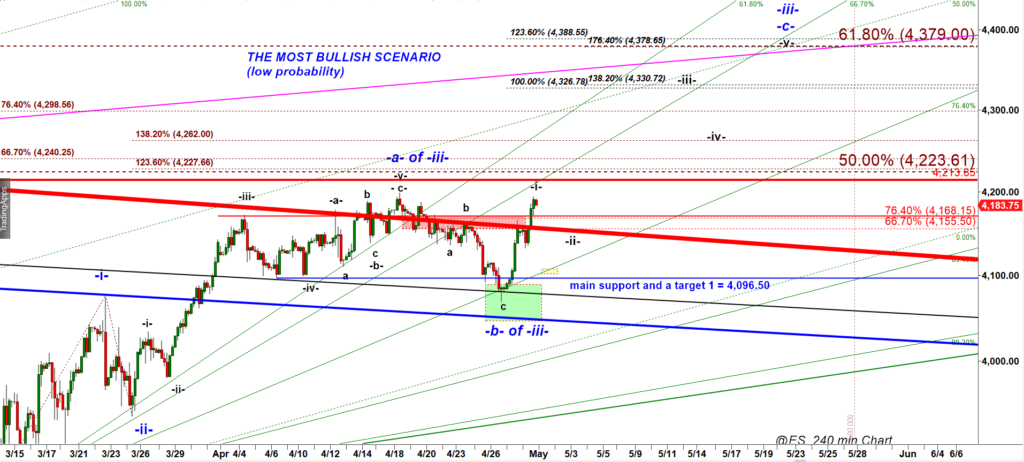
Under the most bullish scenario the Friday rally was only the very first micro eave i up in a new five wave up leg targeting 4,390. That scenario looks a way too bullish to me.

Scenario (3) The Moderate Bullish, (w)-(x)-(y) structure.

At the beginning of this update I noted that the first leg up that started in October 2022 and topped in December 2022 was structured as a three wave up move.

It is reasonable to expect that the second leg up that started in the middle of March 2023 would be also structured as a three wave up. When a corrective structure is shaped as three waves up, three waves down and then three waves up we call it the Double Three and label waves as (w) up, (x) down, (y) up.

ES-mini 240 min chart

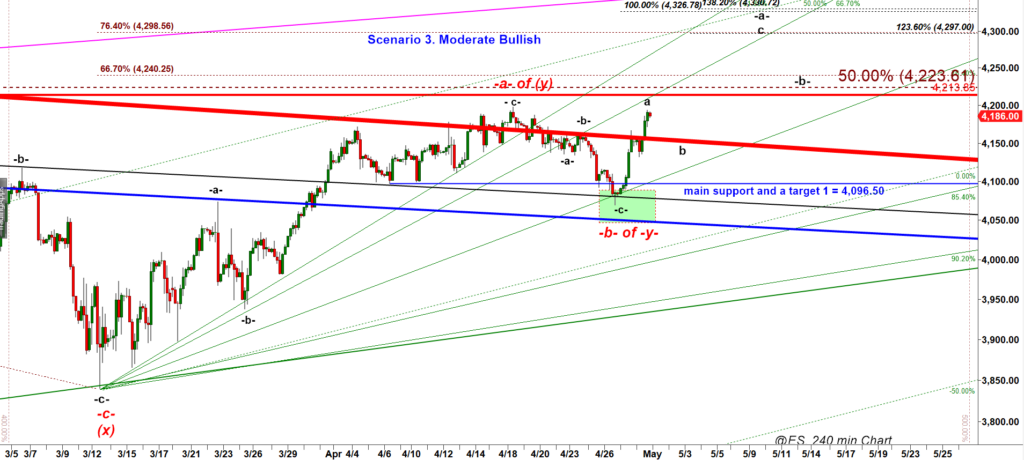
Under that 3-3-3 or (w)-(x)-(y) up scenario the rally that topped in early April was only the first half of the second leg up, a subwave -a- of a wave (y) up. Therefore, the rally that started on Thursday – Friday was the beginning of the second half of that wave (y) up, its subwave -c- up.

Under that count, the subwave -c- of wave (y) up should stretch to 123.6% – 138.2% ext of the subwave -a- up. That implies two long term targets: 4,511 and 4,560.

And here again I should confess that I hardly can envision such a strong rally. At this point I favor the Scenario 1 with a limited upside left for bulls.

But even that least bullish scenario 1 may not bring relief to bears:

ES-mini, 240 min chart

Ideally bears should re-test the thick red line rom above (4,140-4,130). Moreover, that subwave -b- down may get even more shallower if it gets shaped as a bullish Running Flat structure:

ES-mini chart, 240 min

The conclusion:

4,145-4,130 is a strong support.

Any pullback to that support would looks like a promising long setup.

To question those bullish scenarios bears need to push ES under 4,100.

At this point a move over 4,200 looks inevitable.

The only question what kind of a pullback e can get during the volatile period associated with teh first three trading days of a month.

Subscribe to Free Updates

Get Unlimited Access

PrevPreviousES: Rallied as Expected, It’s Time for Consolidation Now
NextES: This Pullback is Setting the Stage for a Rally Over 4,200Next

More To Explore

$ES: Bears Have A Clean Setup

$ES #ELLIOTT WAVE #trading setup #short setup Bulls squeezed a slighly higher high on Thursday. But ES closed back under

CastAwayTrader May 9, 2025

$ES: Bears Failed to Break the Monthly Support

$ES #Month Opening Range Yesterday, I anticipated a classic “pump-and-dump” scenario following the FOMC announcement. However, that move didn’t materialize.

CastAwayTrader May 8, 2025

Important Disclaimer

CastAway Trader LLC, the publisher of this web-site and videos is not registered as an investment adviser nor a broker/dealer with either the U. S. Securities & Exchange Commission or any state securities regulatory authority. Users of the website www.castawaytrader.com and viewers of the videos are advised that all information presented on the website is solely for informational purposes, is not intended to be used as a personalized investment recommendation, and is not attuned to any specific portfolio or to any user’s particular investment needs or objectives.

Trading stocks, options, or futures carries a high level of risk, and may not be suitable for all investors. Before deciding to trade, you should carefully consider your objectives, financial situation, needs and level of experience. CastAway Trader LLC provides general overview of trading methods that does not take into account your objectives, financial situation or needs. The content of this website must not be construed as personal advice. All trading setups and/or trades presented in the web site and/or trading chat room by CastAway Trader an/or by other members of the chat should be considered hypothetical for educational purposes only and should not be expected to be replicated in a live trading account.

An investor could potentially lose all or more than the initial investment. You should not speculate with capital that you cannot afford to lose. Only risk capital should be used for trading and only those with sufficient risk capital should consider trading. Risk capital is money that can be lost without jeopardizing ones’ financial security or life style.

You should be aware of all the risks associated with trading. You should seek advice from an independent financial advisor.

Any information posted on this web site is not to be construed as an offer to sell or the solicitation of an offer to buy, nor is it to be construed as a recommendation to buy, hold or sell (short or otherwise) any security. All users of the website must determine for themselves what specific investments to make or not make and are urged to consult with their own independent financial advisors with respect to any investment decision. The reader bears responsibility for his/her own investment research and decisions, should seek the advice of a qualified securities professional before making any investment, and investigate and fully understand any and all risks before investing. All opinions, analyses and information posted on the website are based on sources believed to be reliable and written in good faith, but should be independently verified, and no representation or warranty of any kind, express or implied, is made, including but not limited to any representation or warranty concerning accuracy, completeness, correctness, timeliness or appropriateness. In addition, CastAwayTrader LLC and its officers and employees undertake no responsibility to notify such opinions, analyses or information or to keep such opinions, analyses or information current. Also be aware that the owners, officers and employees of the web site www.castawaytrader.com may have long or short positions in securities that may be discussed on the website, Premium Trading Chat room and/or in the videos posted by CastAway Trader LLC.

Past results are not indicative of future profits.

Subscribe to Free Updates

Get Unlimited Access