$ES #ES-mini #trading setup
Let’s review the bearish count and I will explain why that count can not longer be considered a high probability primary scenario:
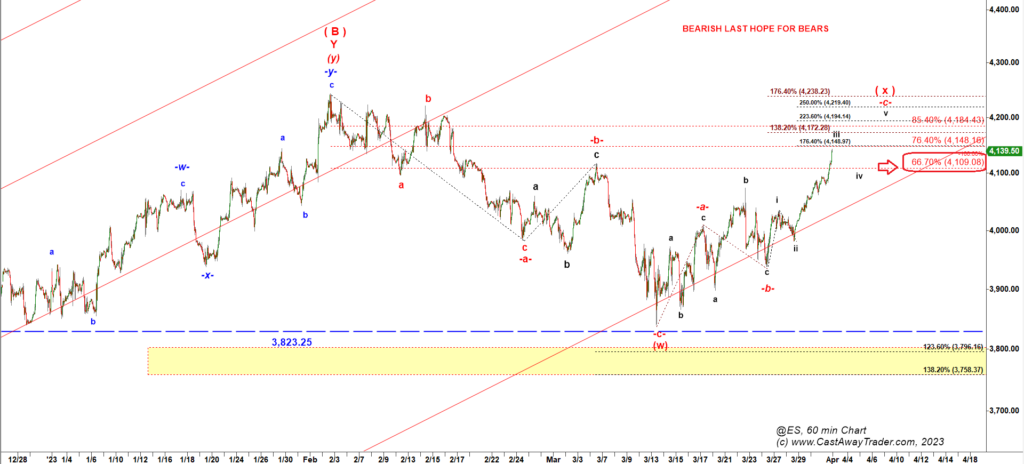
The bearish count considered the high made in Feb 2023 as the top of a large corrective wave (B) up. According to that wave count the -a-b-c move down wave a wave (w) down to be followed by a corrective bounce in a micro wave (x) up.
Based on years of practice and tens of thousands of wave counts I figured out my own rule of thumb that says that we can consider a move up as a countertrend corrective move as long as it stays under 66.7% retracement of the preceding move. In that case it was 4,109. I could tolerate a spike over that level if that spike gets faded into close leaving a long wick on a daily candle. But we did not get a fade into Friday close. Instead we got a spiky move up.
In theory the bearish count is still possible. If bears miraculously pushed ES under 4,109 that would let us ignore the Friday spike. If that miracle does not happen we still will be able to consider that bearish count as long as bears keep ES under 4,150.
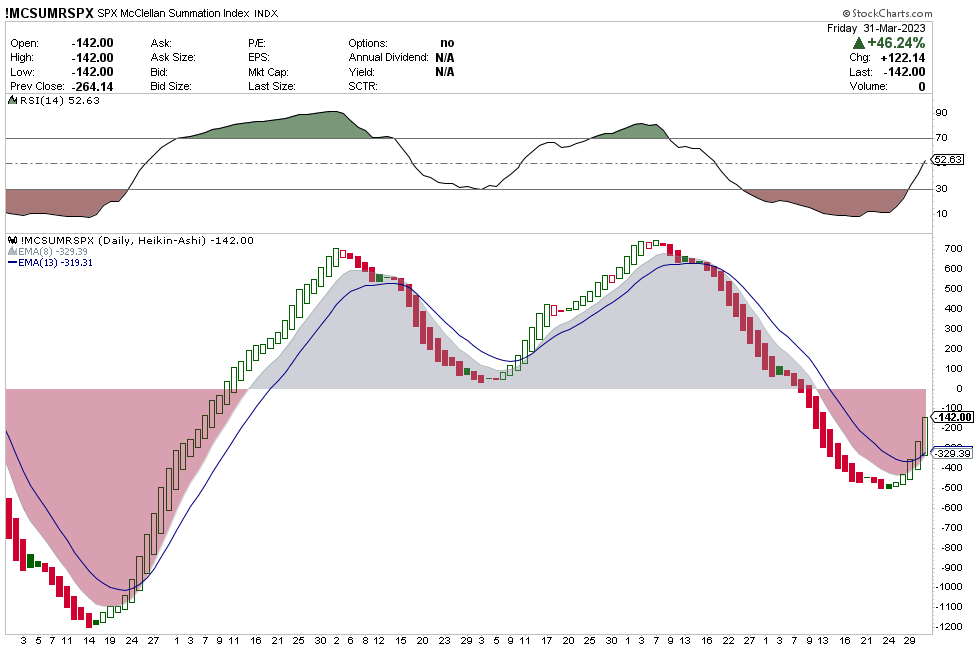
What makes me doubt bearish scenario at this point is that the most important market breadth indicator turned up last week:
This is how a bullish scenario may look like on Daily chart:
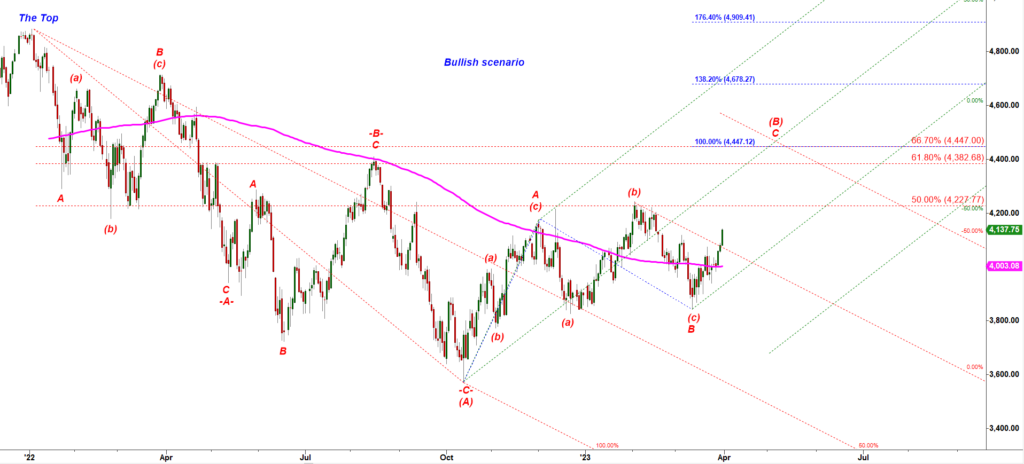
That flat (a)-(b)-(c) up consolidation is the hallmark of my favorite corrective A up, B down, C up structure:
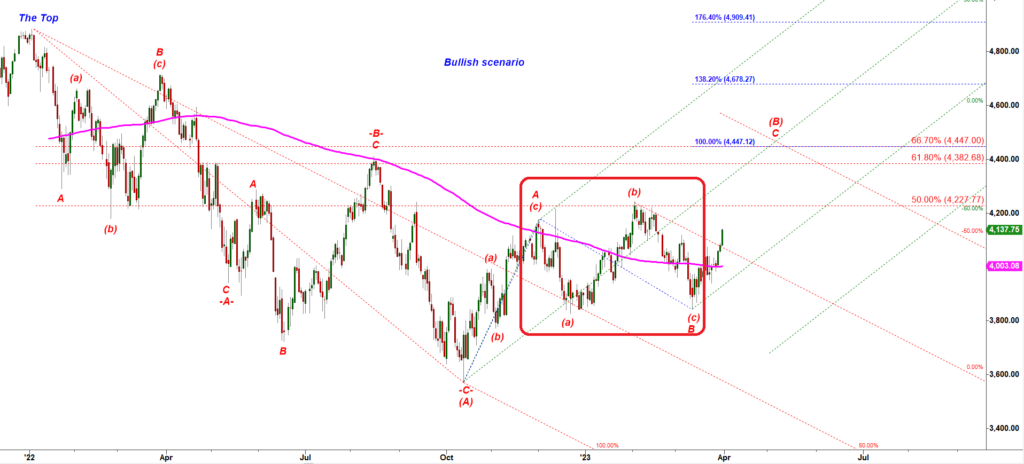
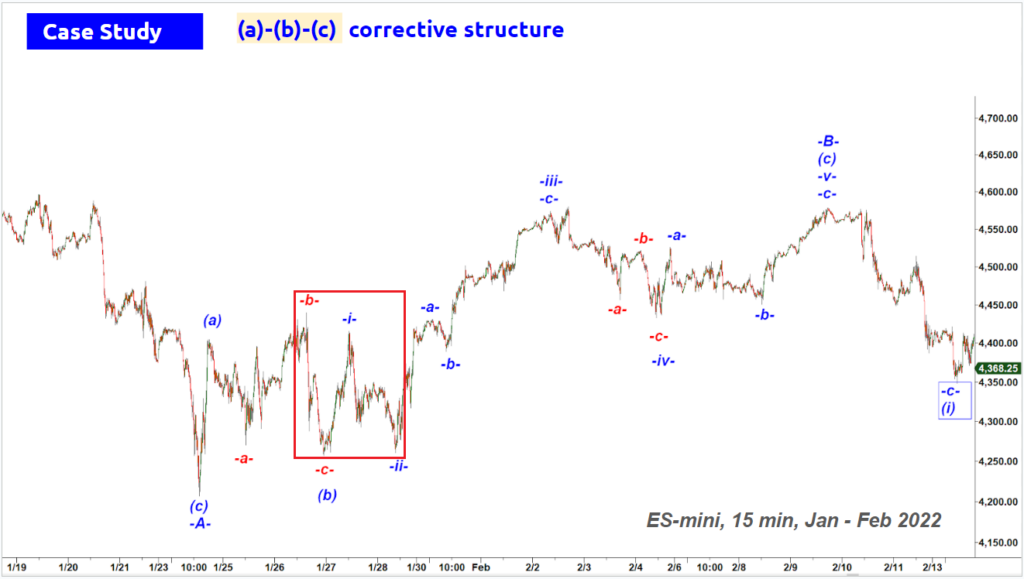
Below I will show you a couple of examples of that same structure that played out in 2022:
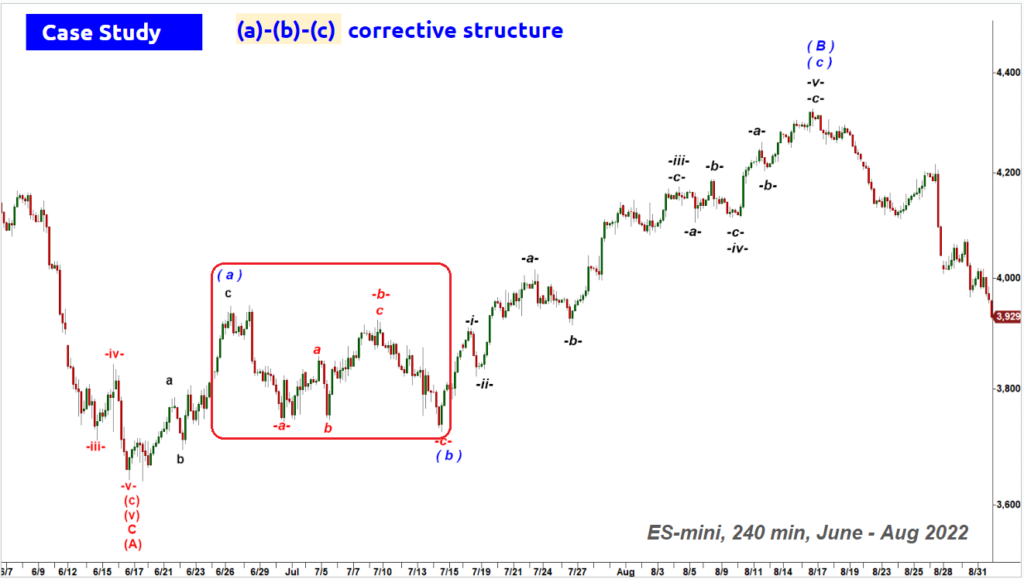
here you can see the very same flat -a-b-c- down consolidation in between of two legs up
If ES keeps following that same fractal we may expect a five wave up rally coming out of that flat corrective (a)-(b)-(c) down structure.
This is how that five wave up rally looked like in July – August 2022:
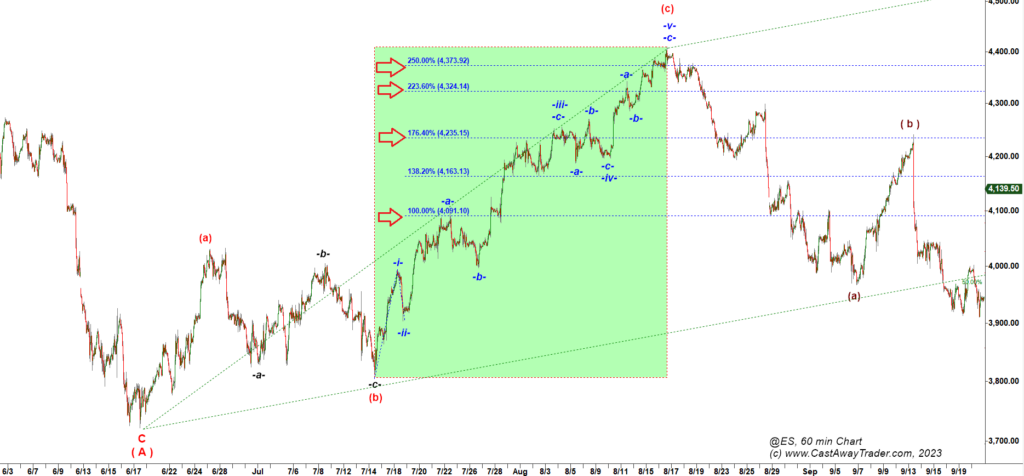
The subwave -a- of wave -ii- up topped at 100% ext of a micro wave -i- up in July 2022.
If ES follows that bullish path then it has to stretch at least to 4,175 before we get a pullback back down to 4,110-4,100.
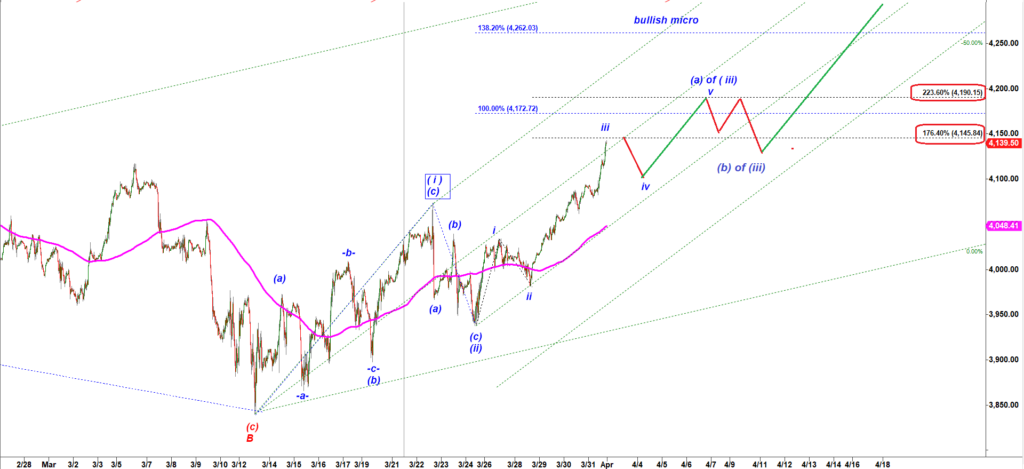
This is a micro path for that rally:
In conclusion:
(i) my preferred breadth indicator confirmed change in trend on Friday; and
(ii) extension of that rally to 4,175 – 4,1900 would confirm the Bullish scenario and will make the bearish one very improbable.
(iii) a pullback from 4,140 – 4,150 down to 4,110- 4,100 would keep the bearish scenario alive. However, as long as bulls hold ES over 4,110 the probability of that bearish count will be low.
(iv) Bears need to produce a daily close under 4,080 to break neck of the bullish count and make the bearish count our high probability primary scenario again.