$ES #ES mini futures #trading setup
In the previous update I shared my expectation for a strong corrective bounce. This is how a macro wave count looks like after the first day of a corrective action:
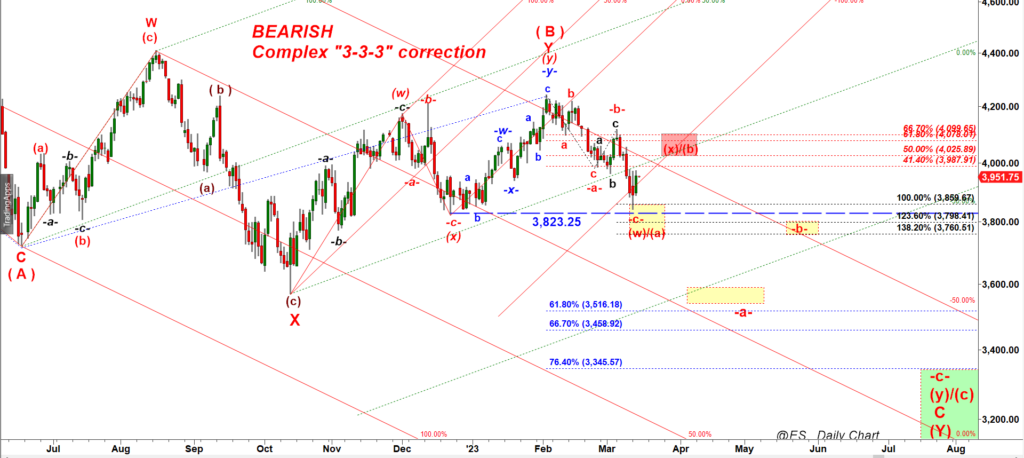
Cycle analysis suggests that this large wave C of (Y) down may keep leaking lower until August 2023.
As I explained in the Sunday update, I expect this move down to follow a Double Three complex structure, a combination o several a-b-c moves down where every new move down would be larger than the preceeding one.
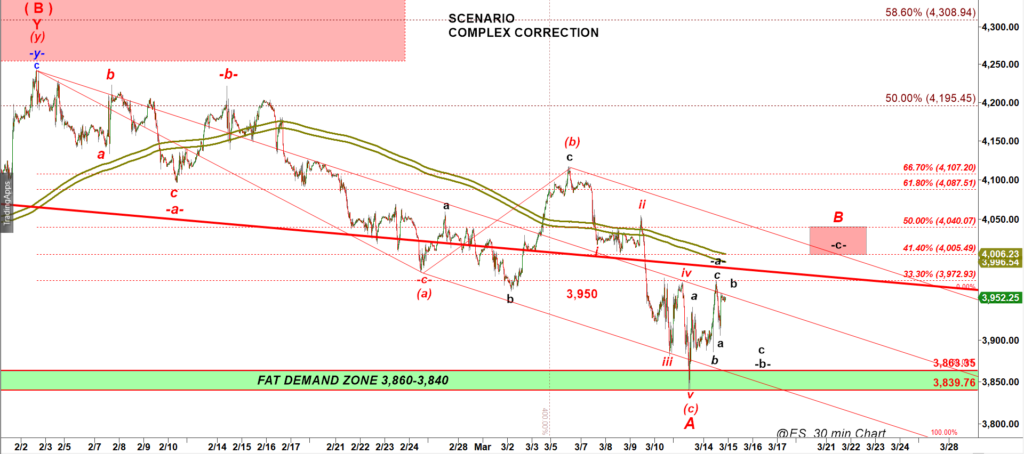
Let’s talk about that bounce an its prospects. To do that we need to zoom-in to a 30 min chart:
There are two ways to count a corrective reaction to the drop that bottom on Monday with a climatic gap down.
(i) Less Bullish micro count:
When you work with a pullback the first thing you do is that you add retracement fibs to the preceding decline.
You always watch several fib ratios: 33.3%, 41.4%, 50% and 66.7%.
The rule is that in 75%-80% of cases the first a-b-c move up stumbles upon 33.3% retracement ratio. That retracement fib demonstrated its power today.
33.3% retracement applied to the whole decline off the Feb top = 3,973. That fib almost nailed the top of the rally today.
But the whole a-b-c up structure tends to top at 41.4% – 50% retracements.
Therefore if we get an a-b-c up bounce that tops at 33.3% retracement you may expect another leg up upon completion of a corrective subwave -b- up.
The second thing you should recall at the moment you approach a corrective bounce is that it will be structured as either a 3-3-3 or a 3-3-5 structure.
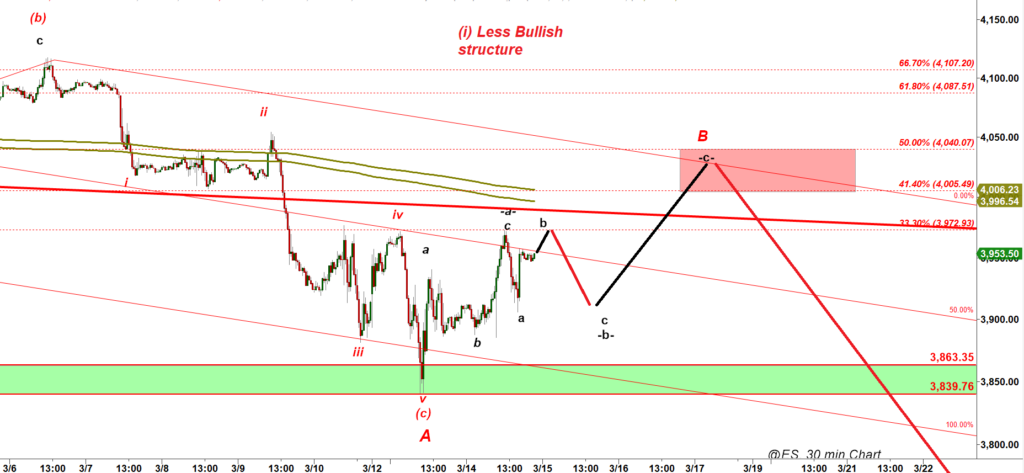
The rule of thumb is either we deal with a 3-3-3 or a 3-3-5 structure the wave in the midllle labelled -b- normally has a clean a-b-c micro structure.
Based on that rule this micro count argues for a potential micro drop in a subwave c of -b- down that can be triggered by PPI data scheduled to be released at 8-30 AM EST on Wed.
Now let’s talk about an alternative bullish wave count (ii):
Quite often when we look at charts of price shown on different timeframes we see different structures.
I still have not figured out whether we should trust more to counts on higher or lower timeframes. Let’s look at the same structure but shown on a nano tick bar chart:
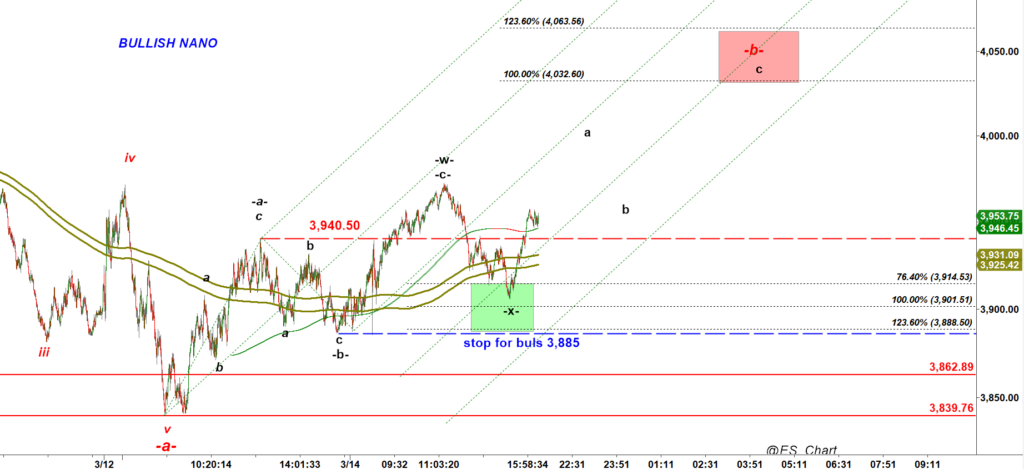
As you can see that same structure looks and counts quite differently.
That wave count allows bulls to keep pushing higher in an a-b-c up structure of a wave (y) up that may push over 4,000. My personal know how is not to let uncertainty to discourage me from trading.
If we get a drop on PPI release according to the count (i) we may go long in anticipation of the second leg up in a subwave -c- up. If ES keeps pushing higher in accordance to the bullish nano count (ii) we will be waiting for a micro a-b-c pullback in a subwave b down of a wave -y- of -b- up.
In both wave counts (i) and (ii) discussed above another push up could be considered as a short setup for another push lower as shown on the daily chart that was explained at the beginning of that update…