$SPX #MACRO #forceast #fractal analysis
Nothing is new under the sun. Over the weekend I scrolled back through the last 70 years of history and found several very similar fractals, patterns of similar corrections played out by S&P 500:

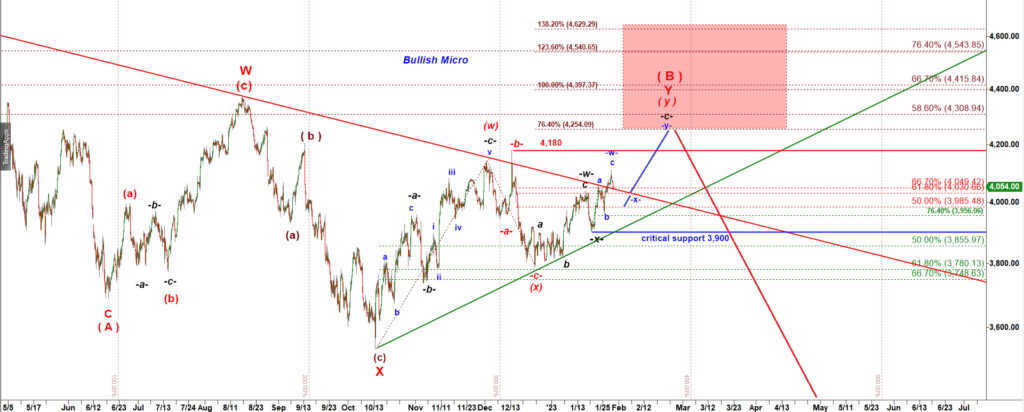
On the left you can see a similar correction played out by S&P 500 in 2002 – 2003. On the right panel you can see the current corrective structure off the high made in Jan 2022.
As you can see, in 2002 bulls tried to start a new rally at point labelled “8” but failed and we got two more legs down.

In 1969 bulls managed to push S&P only slightly higher over the preceding top labelled “6” and then bears stepped in and started a very strong final leg down labelled as “9”.

In 1977 the wave labelled “8” failed again without making a higher high and was followed by a very strong decline.

In 1960th we can see a slightly different variation of that same fractal. The only difference is that wave “5” did not make a lower low under wave “3”.
- The only difference is that wave “5” did not make a lower low under wave “3”. But note a very similar 6-7-8 fractal where bulls managed to push wave “8” over the top of the wave “6”.

In a similar fractal played out in 1953 the wave “8” up managed to make a higher high over the top made by wave “6”. In that case this rally can extend up to 4,230:
In conclusion:
(1) those case studies confirm that S&P has been following a repeating fracatl,
(2) Under the 2002 fractal the market has topped and ready for a big dive, but
(3) Under 1970 fractal bulls can push the market one more time slightly over the Dec 22 high before another leg down starts.