NQ-mini: The Weekend Macro Update

  • CastAwayTrader
  • November 6, 2022
Supercharge Your Trading
Learn More
Get an edge
over millions of other traders
Use our proprietary TradingView indicators
Learn More
Get Our Indicators for Free
subscribe for a trial of the Limited Plus Account
Start Trial
Previous
Next

< Back to All Updates

We continue to follow two bearish structures of a large pullback off the top made in November 2021:

(1) the Very Bearish Scenario:

NQ-mini Daily chart

The Very Bearish scenario considers the move down off the all time high made in Nov’21 as a simple (A)-(B)-(C) down corrective structure where wave (C) is supposed to have an impulsive five wave down internal structure:

Note that NQ popped on Friday afternoon of an important support:

NQ-mini Daily chart, 2021

NQ stopped at 10,733, a double bottom that stopped a pullback in Sep 2021.

Once bears push under that level they will get into an airpocket that would let them quickly drive NQ under 10,000. Because the next macro support is 9,800, the pre-pandemic high made in Feb 2020.

(1.1) The very Bearish Count: micro path:

NQ-mini, 30 min chart

Below is a Very Bearish path down to an obvious Macro Target 1 = 76.4% extension of wave (A) down = 9,765 and Macro Target 2 = 100% extension of wave (A) down = 8,525.

NQ-mini 30 min chart

(2) Scenario 2: The Second Complex “3-3-3” structure does not promise that mauch drama as has been widely expected by Elliott Wave community:

NQ-mini, Daily chart

Both scenarios, the Very Bearish “3-3-5” (the scenario 1) and The Moderately Bearish “3-3-3” structure (the scenario 2):

  • are composed of three waves, (A) down, (B) up, (C) down waves, and
  • argue for continuation of decline down to 8,500- 7,000 in 2023.

The main difference between thos two wave counts is a micro structure of the second leg down of wave (C).

The first Very Bearish “3-3-5” scenario argues for a very strong climatic drop in wave (C) down, a straight line move down to 8,500-8,000.

The second moderate and complex “3-3-3” fractal argues for similar targets but it suggests a much more complex way leading there:

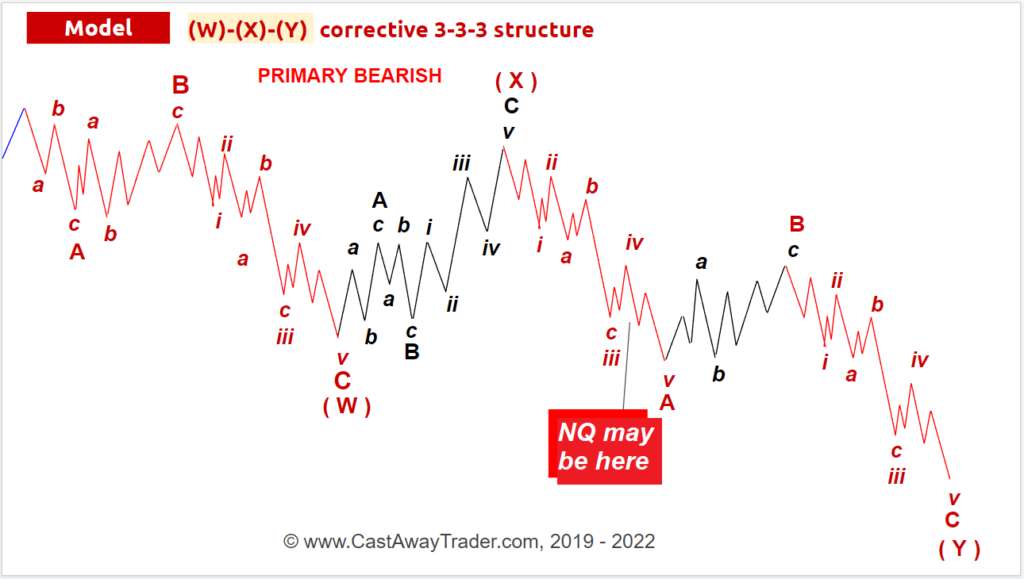
Under that complex “3-3-3” structure bears may push NQ down to 9,800 in wave (v) of A of (Y) down:

NQ-mini Daily chart

Such a drop to 9,800 (re-testing from above the pre-pandemic high made in Feb 2020) would complete a large wave A down that started in mid August 22 and set the stage for a large pullback in wave B up that can to by the year end (the Santa’s Rally).

(3) Scenario 3: An Alternative Bullish Count:

NQ-mini Daily chart

Unfortunately, we have to discuss another one, an alternative bullish count that does not allow bears to push down to 9,800. At this point that count has to be considered as a low probability alternative count because NQ has been the weakest index and it is located under ALL moving averages (8 EMA, 21 EMA, 50 SMA, 200 SMA).

To invalidate that bullish count bears need to break under 10,484, the starting point of a micro wave (i) up.

As always, when we deal with any bullish (i) up, (ii) down long setup we HAVE TO be mentally and financially prepared to go short on breakdown under the starting point of wave (i ) up. Such a decline not only would invalidate the bullish (i) up, (ii) down count, but itself would be become an attractive short setup.

Read my blog post explaining how invalidation of (i) up, (ii) down long setup should be considered as an attractive short setup!

In conclusion:

The Scenario 2, the Complex “3-3-3” count remains my favorite one because its the most tricky and least expected one.

Bonus:

NQ-mini Daily chart

We can see a stable time cycle that connects high and lows this year.

That cycle argues that we can make an important low (or High) on Nov 16-18.

Subscribe to Free Updates

Get Unlimited Access

PrevPreviousNQ-mini: Initial Positive Reaction on NFP May Later Lead to a Breakdown
NextES-mini: The Weekend Macro UpdateNext

More To Explore

ES: Bears Have a Setup to Turn ES Down

$ES #ES-mini futures #trading setup #wave C down Yesterday bulls hit the Red Target box under the Bullish scenario: The can push higher into the Red Box to tag the Target 2 = 4,106.25. Note

CastAwayTrader March 31, 2023

ES: A Crispy Clean Diagonal Wave Count

$ES #ES-mini futures I found a really clean wave count that can be used for forecasting the next big move in ES-mini. Let’s first start from our primary bearish wave count on a daily timeframe:

CastAwayTrader March 30, 2023

Important Disclaimer

CastAway Trader LLC, the publisher of this web-site and videos is not registered as an investment adviser nor a broker/dealer with either the U. S. Securities & Exchange Commission or any state securities regulatory authority. Users of the website www.castawaytrader.com and viewers of the videos are advised that all information presented on the website is solely for informational purposes, is not intended to be used as a personalized investment recommendation, and is not attuned to any specific portfolio or to any user’s particular investment needs or objectives.

Trading stocks, options, or futures carries a high level of risk, and may not be suitable for all investors. Before deciding to trade, you should carefully consider your objectives, financial situation, needs and level of experience. CastAway Trader LLC provides general overview of trading methods that does not take into account your objectives, financial situation or needs. The content of this website must not be construed as personal advice. All trading setups and/or trades presented in the web site and/or trading chat room by CastAway Trader an/or by other members of the chat should be considered hypothetical for educational purposes only and should not be expected to be replicated in a live trading account.

An investor could potentially lose all or more than the initial investment. You should not speculate with capital that you cannot afford to lose. Only risk capital should be used for trading and only those with sufficient risk capital should consider trading. Risk capital is money that can be lost without jeopardizing ones’ financial security or life style.

You should be aware of all the risks associated with trading. You should seek advice from an independent financial advisor.

Any information posted on this web site is not to be construed as an offer to sell or the solicitation of an offer to buy, nor is it to be construed as a recommendation to buy, hold or sell (short or otherwise) any security. All users of the website must determine for themselves what specific investments to make or not make and are urged to consult with their own independent financial advisors with respect to any investment decision. The reader bears responsibility for his/her own investment research and decisions, should seek the advice of a qualified securities professional before making any investment, and investigate and fully understand any and all risks before investing. All opinions, analyses and information posted on the website are based on sources believed to be reliable and written in good faith, but should be independently verified, and no representation or warranty of any kind, express or implied, is made, including but not limited to any representation or warranty concerning accuracy, completeness, correctness, timeliness or appropriateness. In addition, CastAwayTrader LLC and its officers and employees undertake no responsibility to notify such opinions, analyses or information or to keep such opinions, analyses or information current. Also be aware that the owners, officers and employees of the web site www.castawaytrader.com may have long or short positions in securities that may be discussed on the website, Premium Trading Chat room and/or in the videos posted by CastAway Trader LLC.

Past results are not indicative of future profits.

Subscribe to Free Updates

Get Unlimited Access