The Most Important Pattern: The Five Wave Impulsive structure
I recommend you to consider the Elliott Wave theory in a simple way. Consider it just a collection of repeating patterns. If you read any book about technical analysis you might have heard about “head and shoulders”, “flags”, “pennants”, “double top” and “double bottom”.
The Harmonic Elliott Wave theory provides traders with a tool box that allows them to identify and track development of several repeating patterns that can be found on stock charts. That set of rules can be successful applied to charts showing prices of stocks, futures, forex pairs and other tradeable assets (including crypto currencies).
The cornerstone of the Harmonic Elliott Wave theory is the Five Wave up fractal:
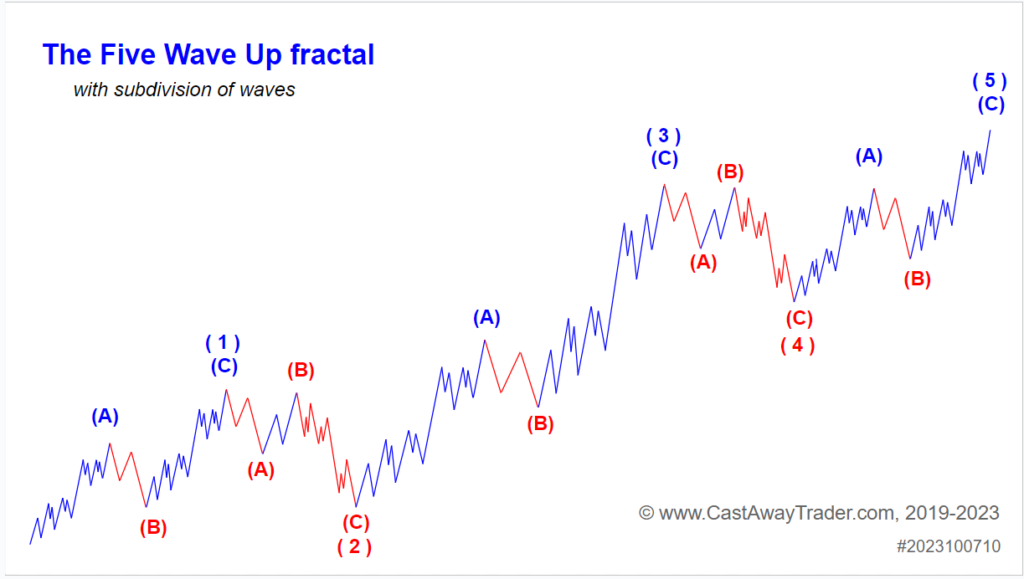
Every up trending stock normally closely follows that path described by the Five Wave up pattern (or fractal) shown above. The simplest way to describe the wave analysis as the process of looking for signs that a stocks has been following the five wave up fractal. What a wave analysts do is they match squiggles produced by a stock price on a chart with the shape of specific parts of the fractal above (we call segments of repeating patterns the waves).
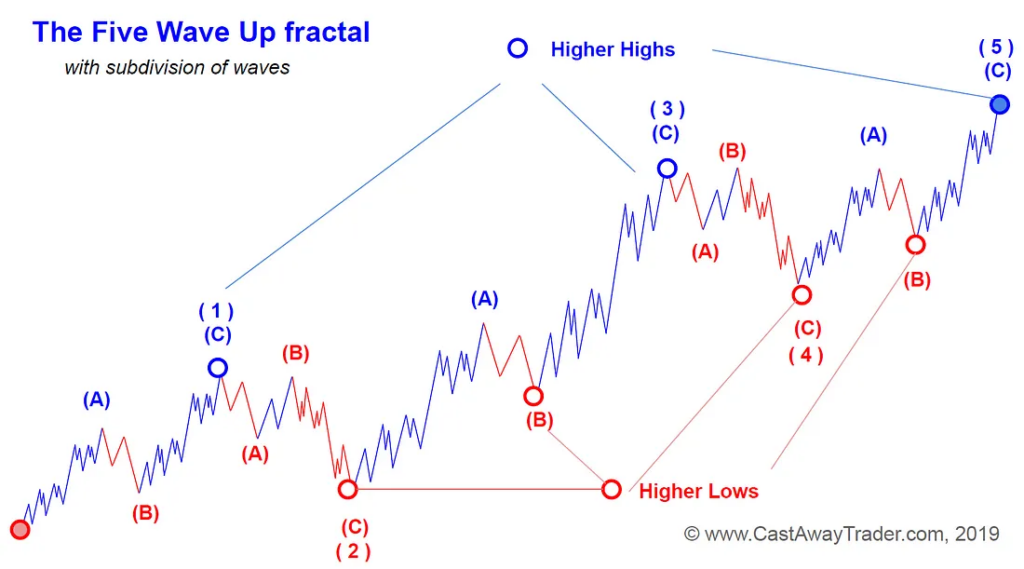
The starting point of any trending move up (the bull market) is the lowest point for the following years. We call a price move “the trend” when it keeps making higher highs and higher lows:
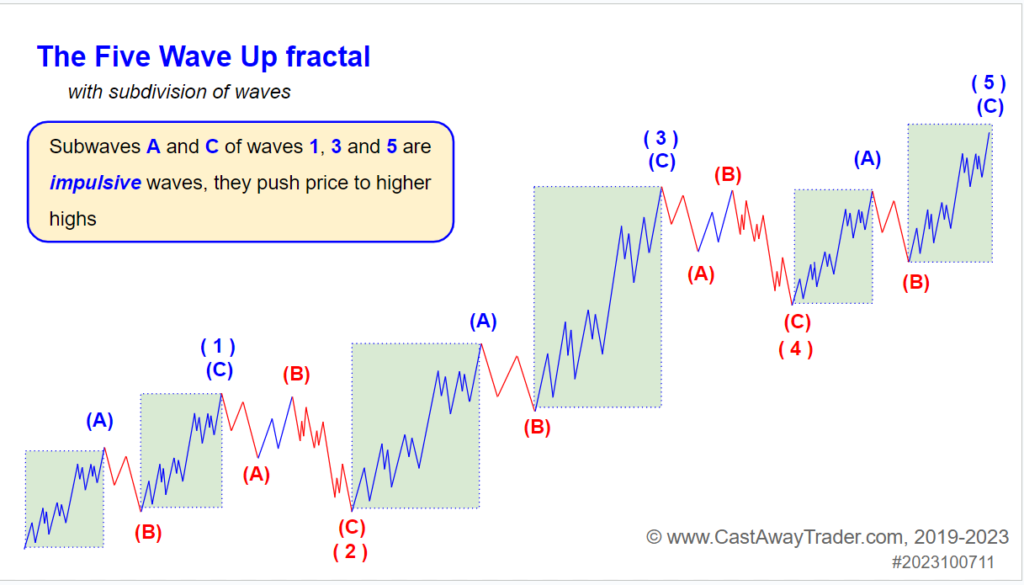
You can see that those moves that push price to new highs are colored in blue color. Traders who believe that price will get higher keep buying the asset and push its price higher. We call moves in the direction of the main trend that make higher highs in price impulsive waves. Impulsive waves are themselves structured as the Five Wave up fractal but of a smaller size. That means that if you zoom-in you will see that every impulsive wave is composed of five micro waves of smaller size.
But every impulsive wave is followed by a corrective wave, a temporary pullback driven by traders who feel skeptical about continuation of the move higher.
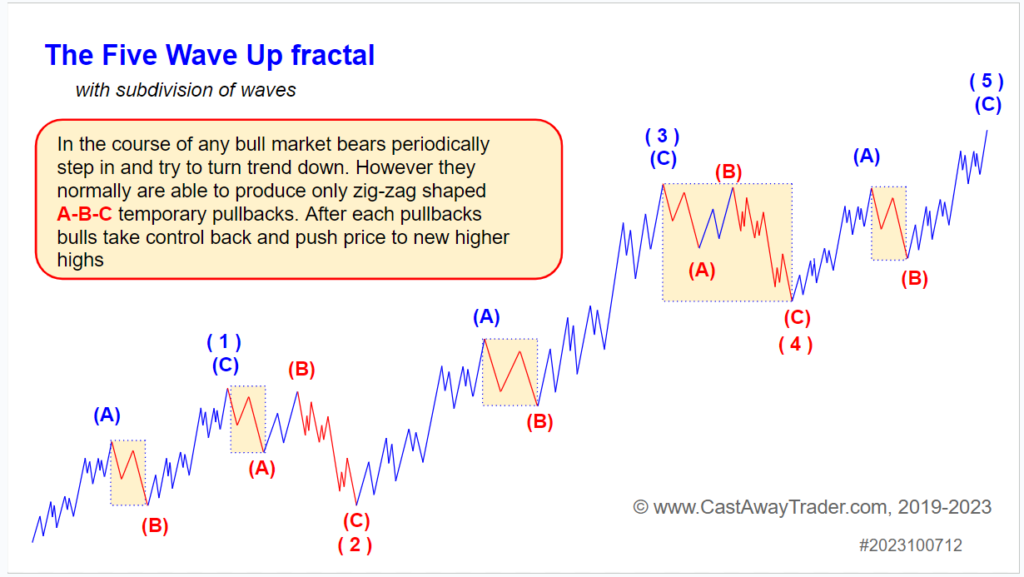
This dynamic, where price progress involves a step up followed by a step back down, creates trading opportunities. A skilled wave trader’s strategy revolves around identifying the unfolding five-wave pattern on the stock chart to confirm the direction of the prevailing trend. The next step is to look for corrective pullbacks as opportunities to open positions, to take advantage of the imminent move in the direction of the overall trend.
In the next chapter we will study the most common patterns of corrective pullbacks.
New Video Course!