$ES #ES-mini #long setup #failed breakdown #Expanded Flat
We will be watching two alternative scenarios / wave counts:
(1) The Bearish wave count:
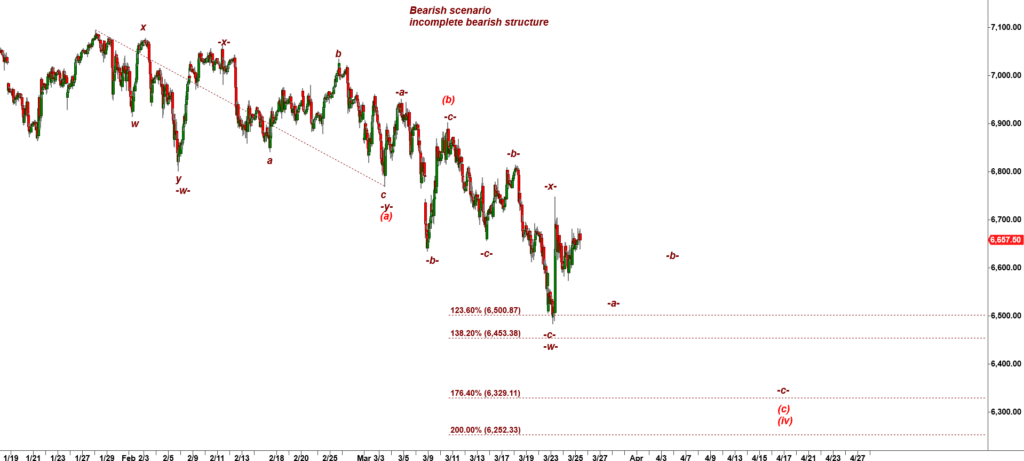
ES-mini 60 min chart
The rally we got on Sunday night – Monday morning looks like the textbook corrective bounce in a wave -x- up, a premature attempt to start a new rally off incomplete corrective structure. The spiky look of that move up is the main argument in favor of the bearish scenario.
Under that wave count bears should be able to produce another a-b-c move down.
(2) the Bullish alternative scenario:
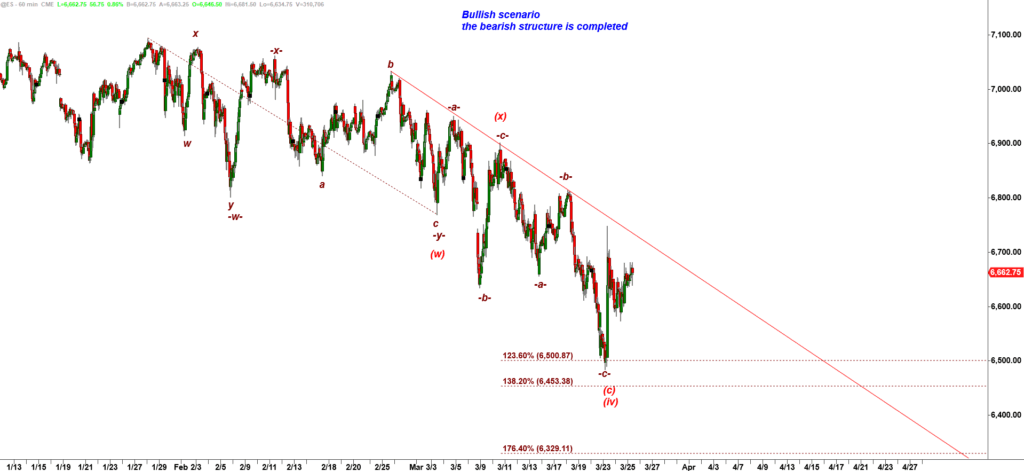
Es-mini 60 min chart
I may be overcomplicating the corrective structure in play and one can reasonably argue that we got enough micro waves to consider a large (w) -(x)-(y) down structure having bottomed.
This is how the bullish scenario looks on a Daily chart:

ES-mini Daily chart
6,634.50 is the Maginot line, the critical level that separates the bearish from bullish scenarios. Let me explain why:
Zooming-in:
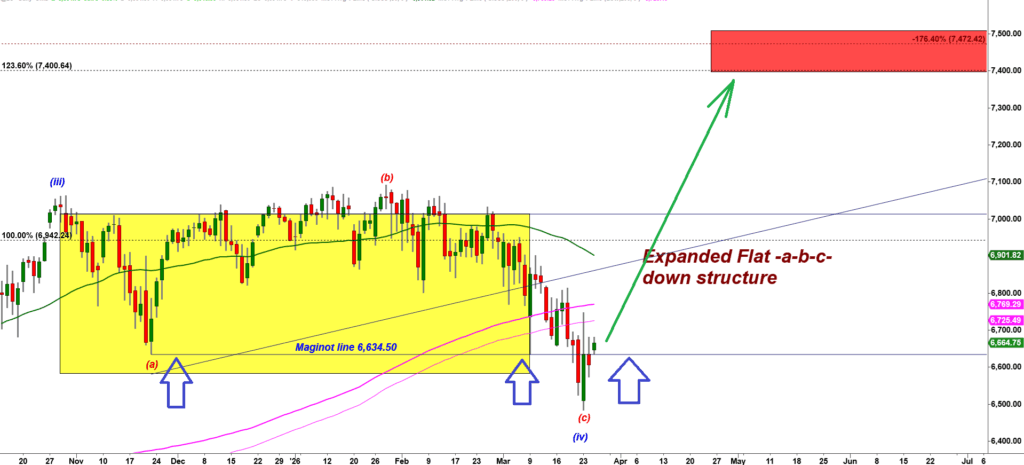
ES-mini Daily chart
6,634.50 is the low made by the first leg down, wave (a).
The Expanded Flat structure is tricky because, at its conclusion, the second leg down — wave (c) — breaks below the low of the first leg down (wave (a)). That breakdown creates a classic bear trap.
The move below the wave (a) low is usually short-lived. Almost immediately, large players step in and push price back above the wave (a) low, trapping momentum traders who went short on the breakdown under support.
This is why a reclaim of that level often triggers a strong short-covering rally, powered by forced liquidation of short positions.
That is why bulls need to hold ES above 6,634.50 to keep this bullish scenario alive.