In my Wednesday update I shared the bearish scenario
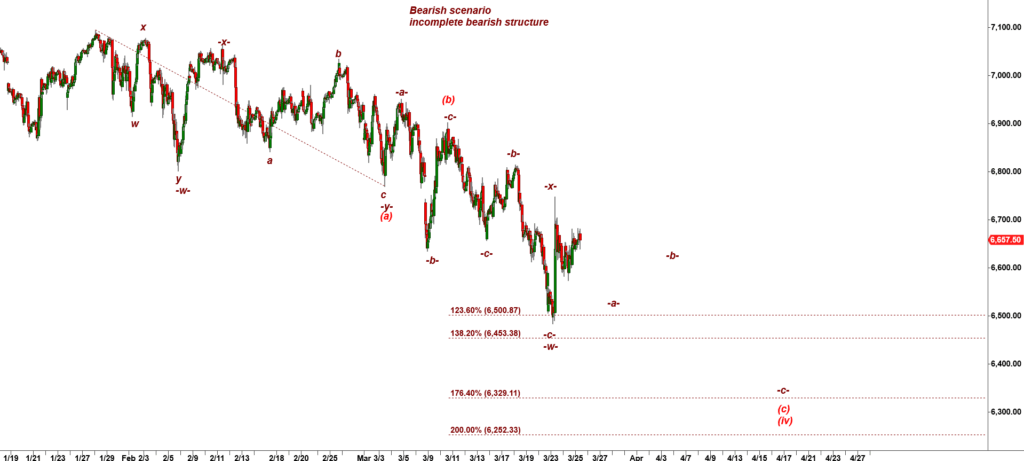
That bearish wave count assumed that the rally we got on Sunday night – Monday morning looked like the textbook corrective bounce in a wave -x- up, a premature attempt to start a new rally off incomplete corrective structure. The spiky look of that move up was the main argument in favor of the bearish scenario.
Under that wave count bears had a setup to produce another a-b-c move down.
6,634.50 was the Maginot line, the critical support level that separates the bearish from an alternative bullish scenarios.
This is how the micro chart, 60 miin:
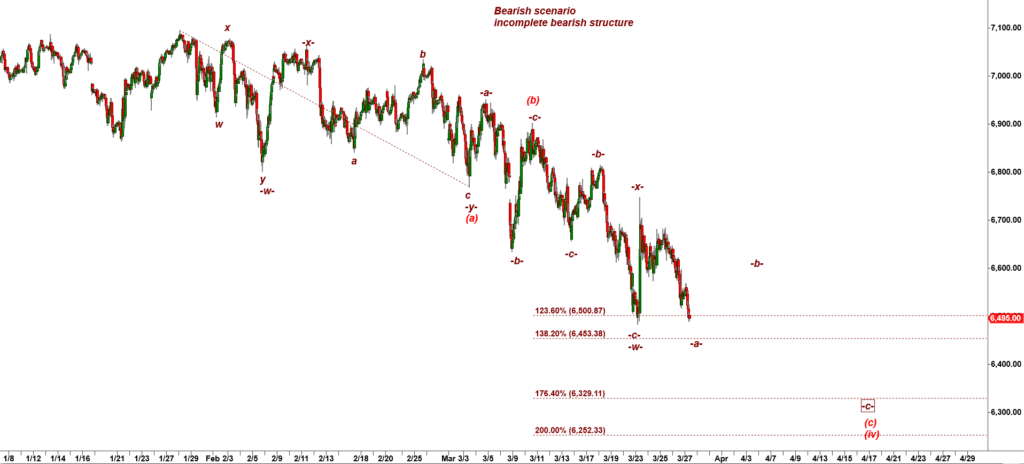
ES-mini 60 min chart
Here ES has arrived at confluence of strong support levels.
Monthly S2 level = 6,480.
Yearly S3 support = 6,508.
If you look at the micro wave count you will see that a subwave -a- down may slightly undercut the previous low made at 6,483.50 but then I would expect a consolidation in a wave -b- up.