$ES #ES-mini #trading setup
This is how the bearish path looks like:
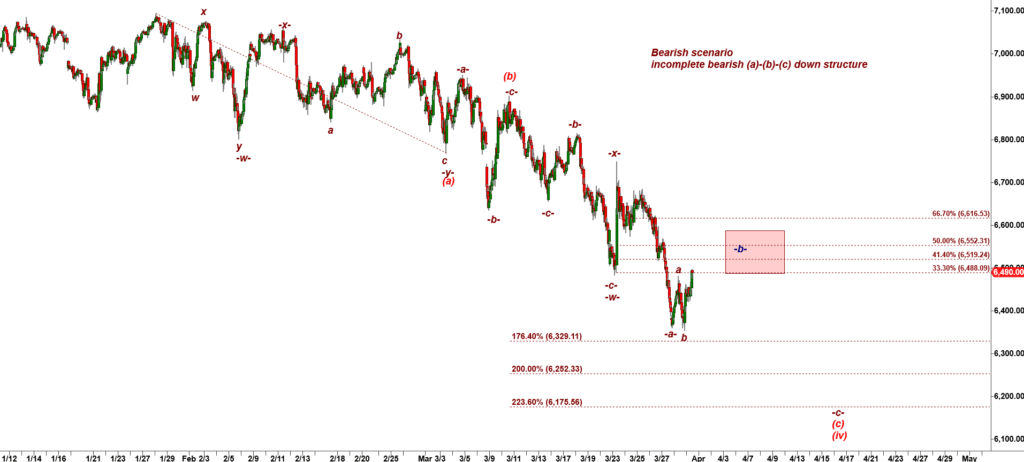
ES-mini 60 min chart
ES is slowly climbing up towards the red box that starts at 6,488.
So far it looks like the textbook a up, b down, c up corrective bounce that is setting up the stage for another leg down in teh final wave -c- down.
Let’s zoom-in to a 15 min chart:
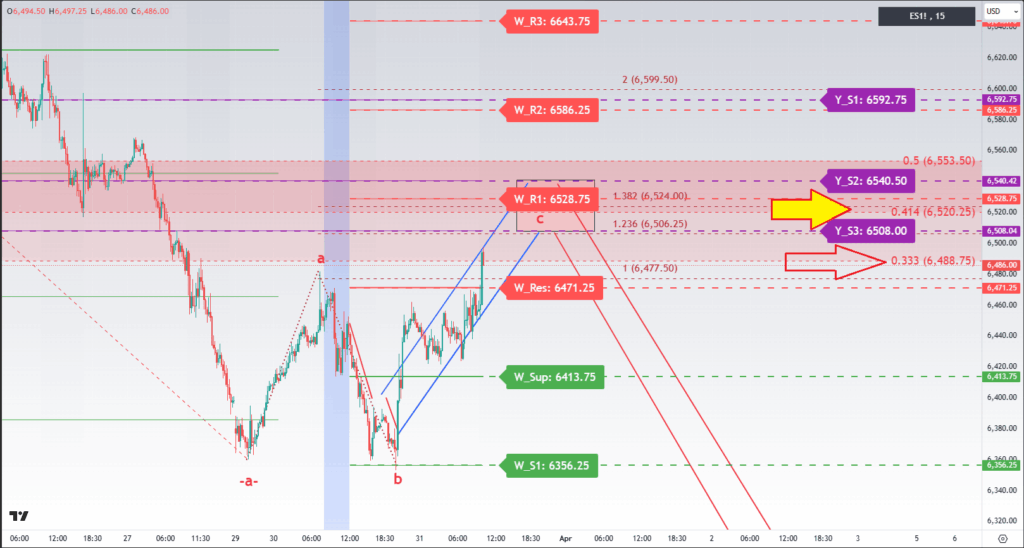
ES-mini 15 min chart
ES has spiked through the weekly resistance 6,471.25.
It has tagged a meaningful resistance at 33.3% retracement of the last completed move down labelled as -a- down.
The 33.3% always becomes the first target for a corrective bounce, a low hanging fruit for bears.
Today is the final trading day of March. Tomorrow the market will start working on the Opening Range for a new trading month.
BONUS: IMPULSE MASTER INDICATOR.
I just want to show you how the market makes turns on different timeframes and how we can use technical indicators to timely spot those turns:
Below are signals printed by my Impulse Master Indicator for TradingView:
Yesterday afternoon we got a fresh green demand zone printed on a 240 min chart:
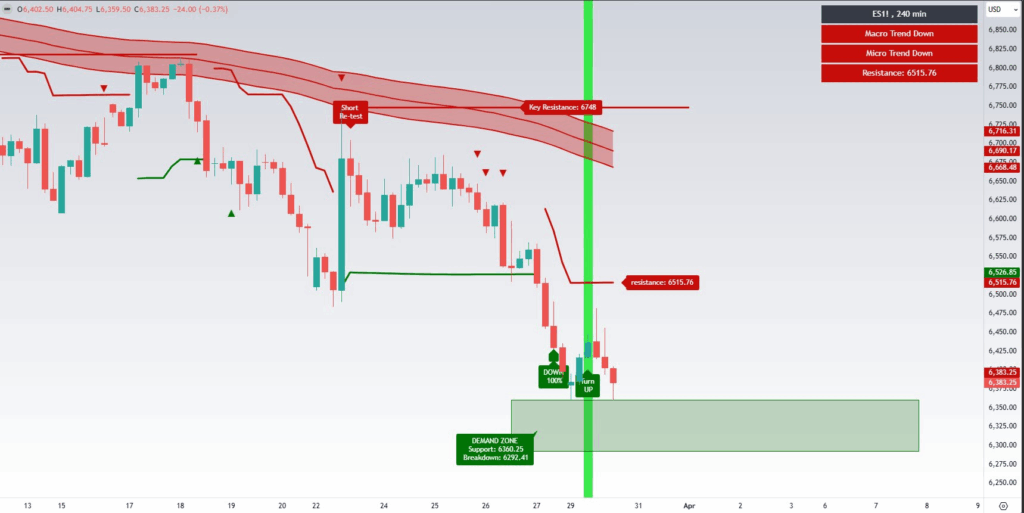
ES-mini 240 min chart
Then we got a fresh demand zone printed at 120 min chart:
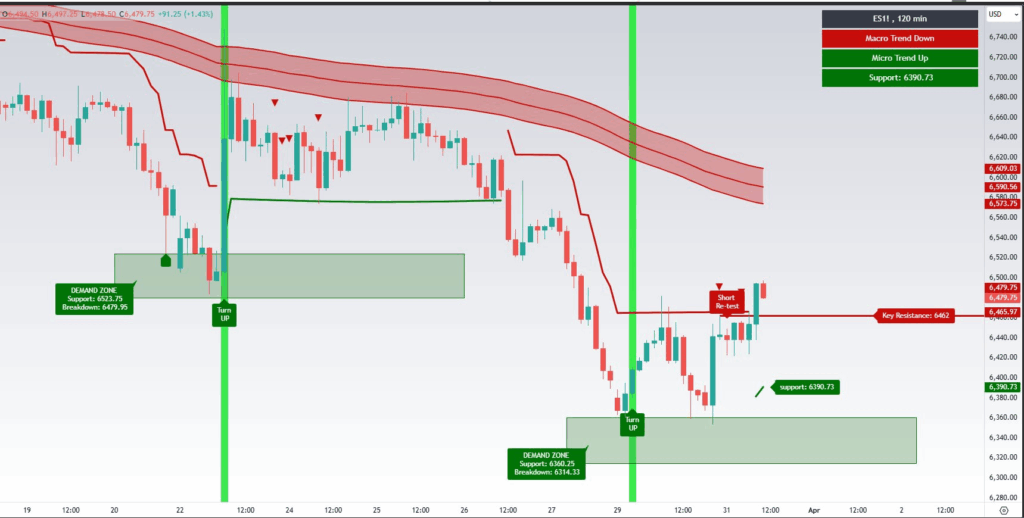
ES-mini 120 min chart
And, finally, we got a micro Demand Zone printed at a 15 min chart:
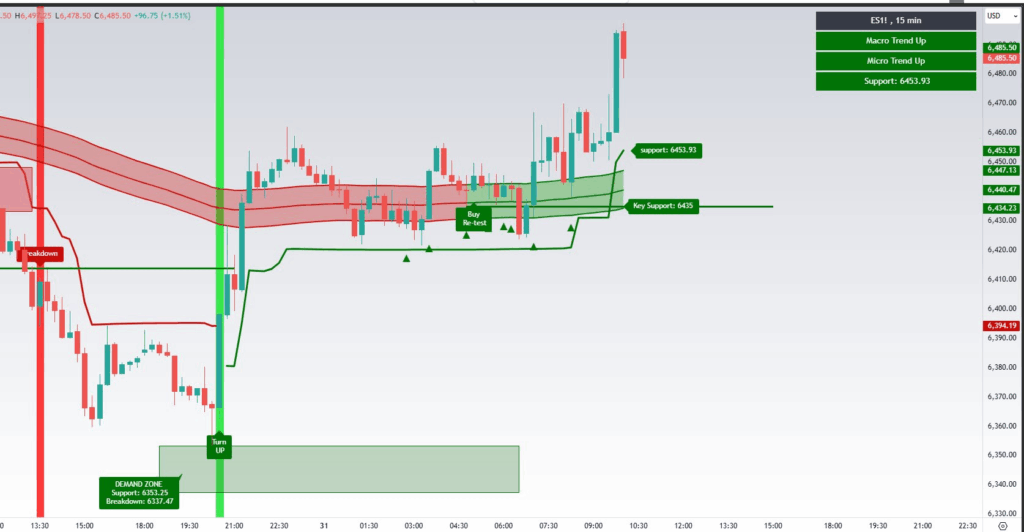
ES-mini 15 min chart
The best turning points are normally confirmed by multiple demand zone signals generated on several timeframes.