$ES #complex correction #long setup
Let me start from a micro update today:
This is how a complex corrective structure looks like:

ES-mini 30 min chart
First, note the initial -a-b-c decline, labeled as -w- down.
That move created the first opportunity for the bulls to begin a rally in wave -iii- up.
Now look at wave -x- up.
This was a failed rally. Bulls attempted to push the price higher but quickly ran out of momentum.
When that happens, we usually expect another -a-b-c structure to the downside to develop.
And that is exactly what we are seeing now.
The decline has already approached the key breakdown level at 6,641.
This is a classic “now or never” moment for the bulls.
Here they get a second opportunity to start a rally in wave -iii- up.
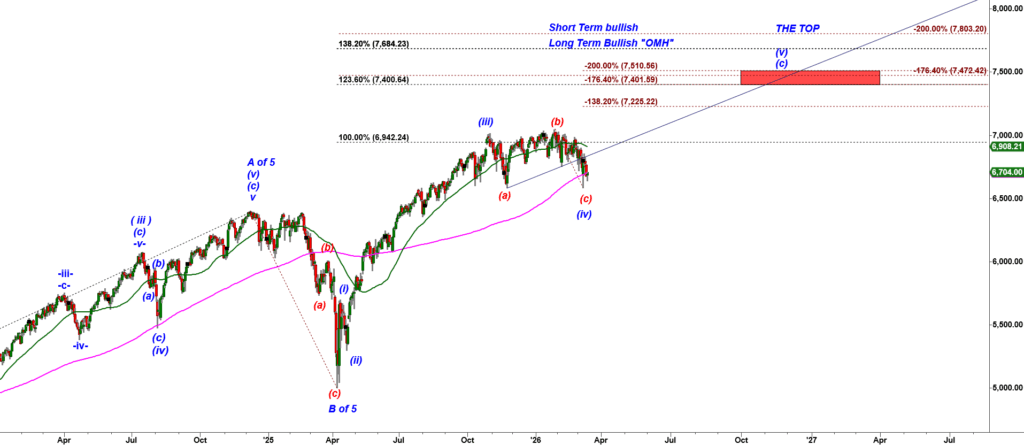
Now lets zoom out and revisit the bullish scenario:
In the previous update we noted that bulls produced a strong bounce because they believe the Sunday drop was conclusion of a relatively large corrective consolidation in wave ( iv ) down:
ES-mini Daily chart
Zooming-in:
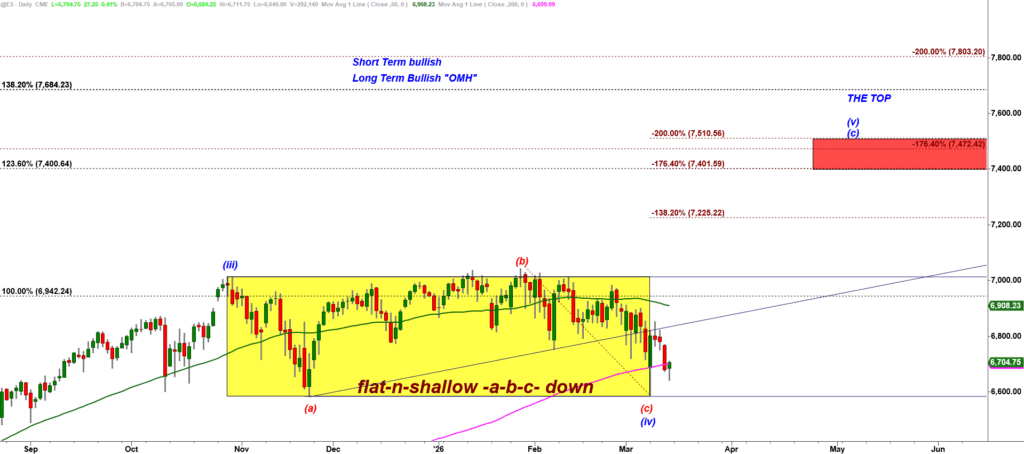
It does not get much better for the bulls than this. This is a textbook example of a flat and shallow consolidation at the top.
The challenge is that bears interpret this pattern as distribution, while bulls see it as reaccumulation.
In the end, the decisive argument often belongs to Wyckoff, whose topping and distribution patterns are widely considered among the most accurate frameworks for identifying market turning points.
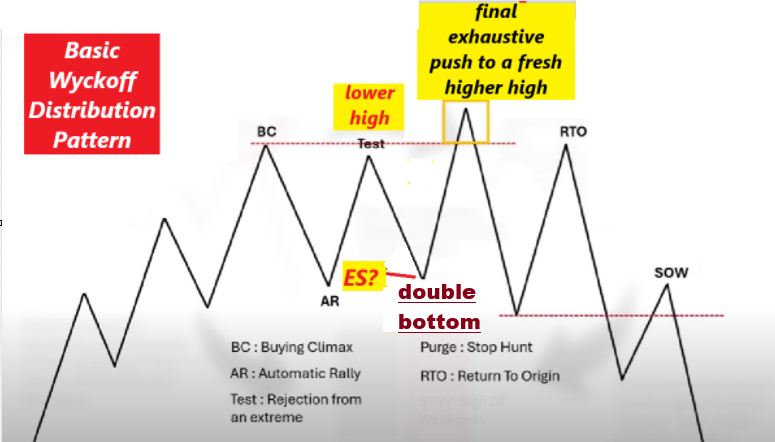
According to Wyckoff, what often follows a double top followed by a double bottom formation is a final exhaustive push to a new higher high.
Price typically breaks above the double top, creating what appears to be a bullish breakout. In reality, this often becomes a bull trap. The spike above the highs is usually short lived. Price quickly runs into aggressive selling pressure, reverses, and drops sharply back below the double top, closing the trap and turning many retail momentum traders into trapped long term holders.
So the bulls still have a chance for one final exhaustive rally, potentially targeting the 7,300–7,400 area.
That rally normally develops as an impulsive five wave structure to the upside.
Therefore, we always try to identify the starting block of that move — the -i- up, -ii- down long setup that can mark the beginning of the final push higher.
And here we can come back to the micro wave count:
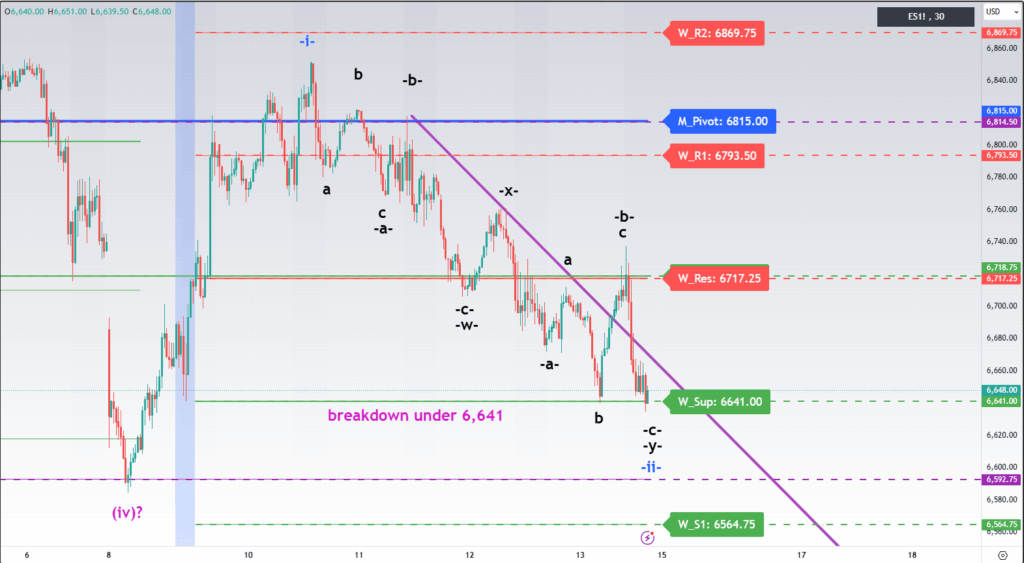
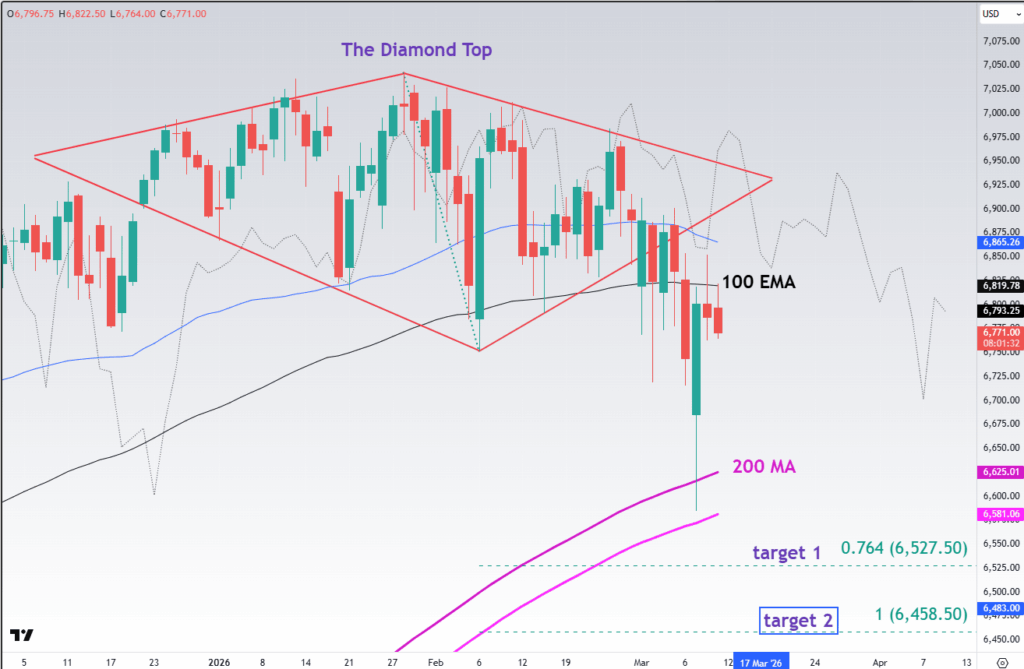
Bulls need to start a rally because a drop under 6,590 would invalidate the bullish -i- up, -ii- down setup and trigger a panic selling to our target 6,527
I will be presenting at an on-line conference next week.
Claim your free spot here. I will be talking about ES-mini, Gold, Silver, Crude oil, Ethereum and Bitcoin.