$ES #Topping Scenario
I have been following two bullish scenarios that allowed bulss to make at least one more rally to a new all time high.
(1) More bullish wave count // Less realistic at this time
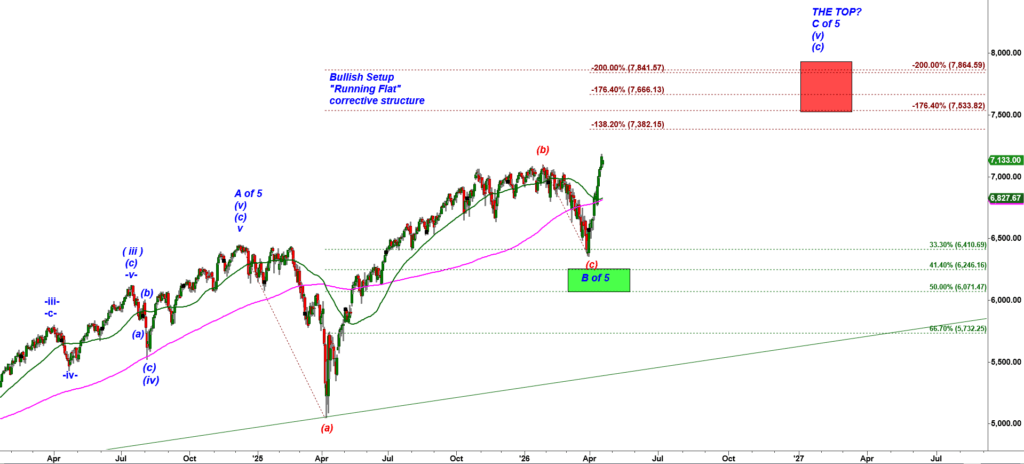
ES-mini Daily chart
If that rally was a starting move of a large subwave C of wave 5 up then we would have got a ( i- Up , ( ii ) down structure off the low made on Mar 31st. But we got a straight line move. That move up looks like an exhaustive suck-everybody-in rally. A wave -i- up never looks like that.
(2) More Bearish the Last run to the to TOP scenario:
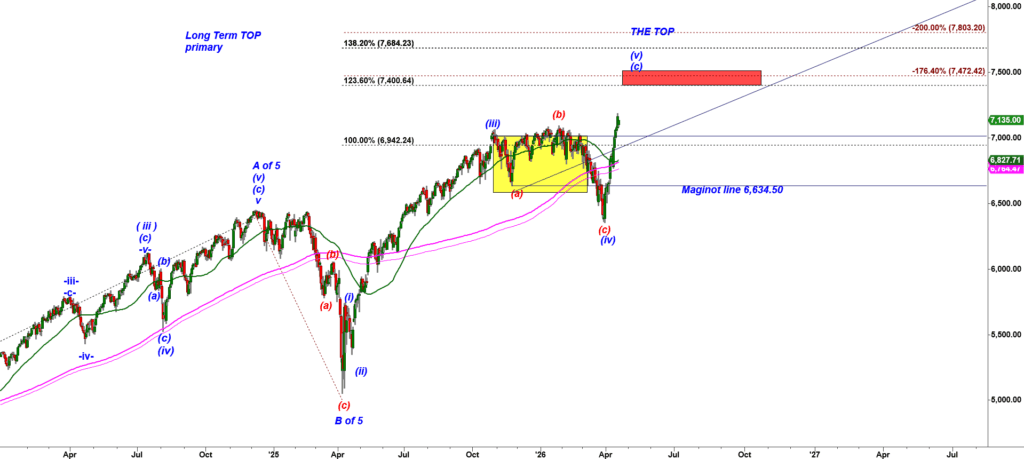
ES-mini 30 min chart
This straight line pop looks like the perfect textbook wave (v) up, the conclusion of a five wave up rally off the low made in April 2025. Technically, that rally has made a new all time high fulfilling the minimum requirement for the wave ( v ). That wave count allows Bulls to push ES-mini higher to tag the Red Box.
Zooming -in to a 30 min chart:
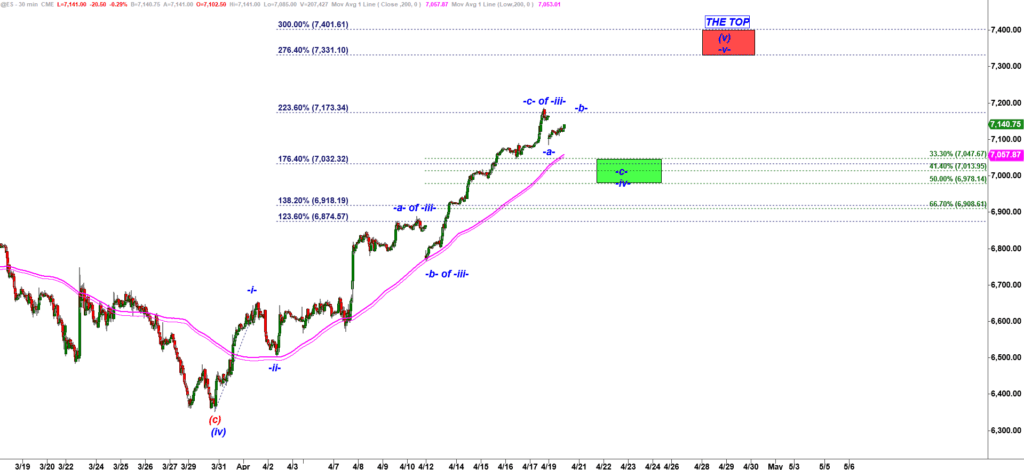
ES-mini 30 min chart
Under that micro wave count bears should be able to push ES down one more time to complete an -a-b-c- down corrective structure of a wave -iv- down building a base for the final bullish push higher to the Red Box that starts at 7,331.