$ES #TopDiamond
We correctly identified a potential for a large move down. What triggered that decline was the Top Diamond pattern:
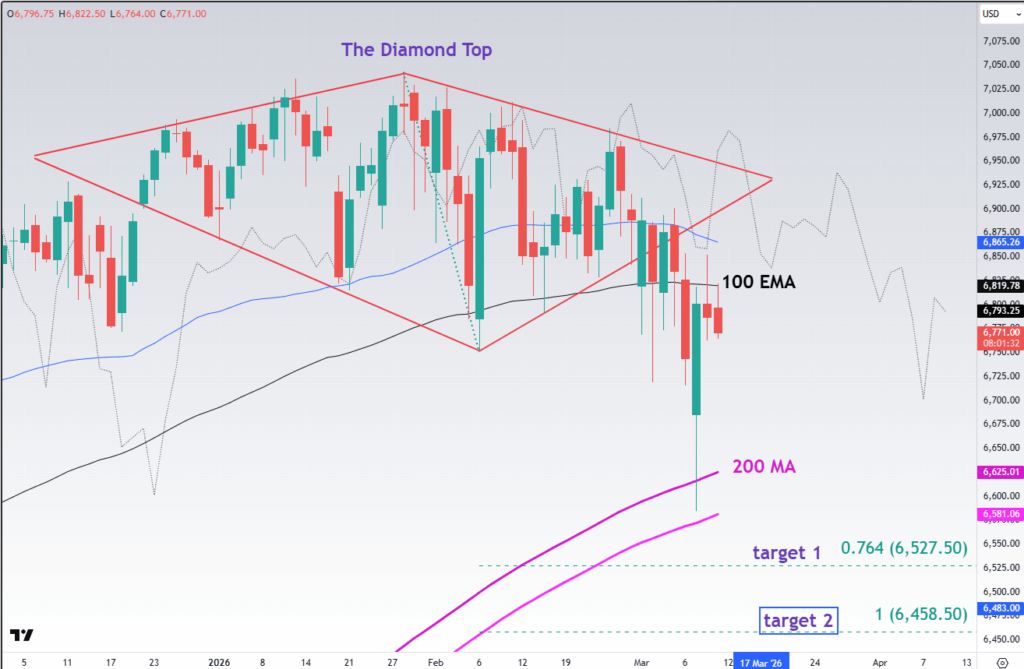
The Sunday sell off stopped right at the confluence of the upward sloped 200 DMA and the Yearly Support S1 level:
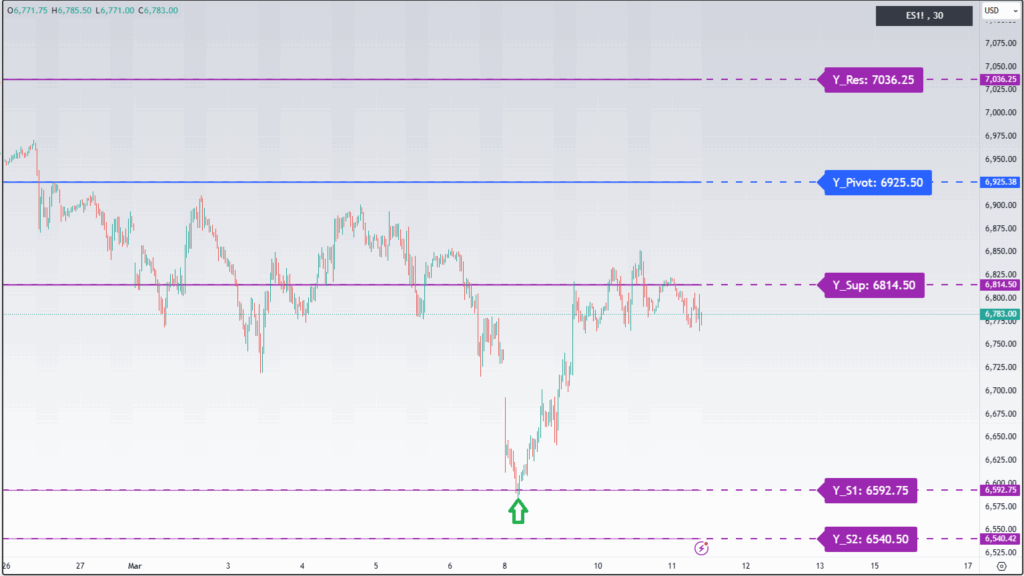
So far the strong bounce we got brought price back up against the broken Yearly Support 6,814.50.
However, bulls have high hopes on that rally.
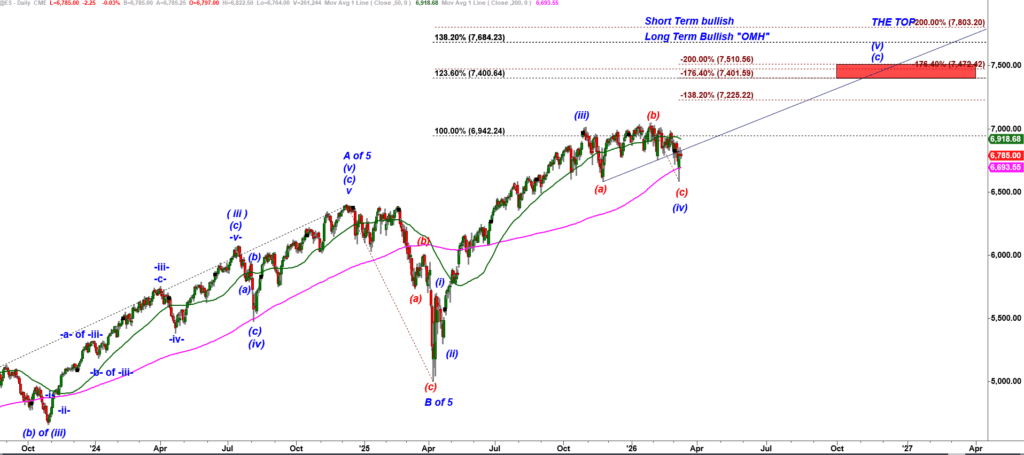
ES-mini Daily chart
Bulls consider the Sunday drop as the culmination of the second leg down in a corrective (a) down, (b) up, (c) down structure. They may argue that was a completion of a corrective wave (iv) down and therefore they turned ES up off the Yearly Support S1= 6,592. Under that wave count the Monday bounce was a micro wave -i- up in a new five wave up move targeting 7,300-7,400.
Let’s look at a micro count on a 30 min chart
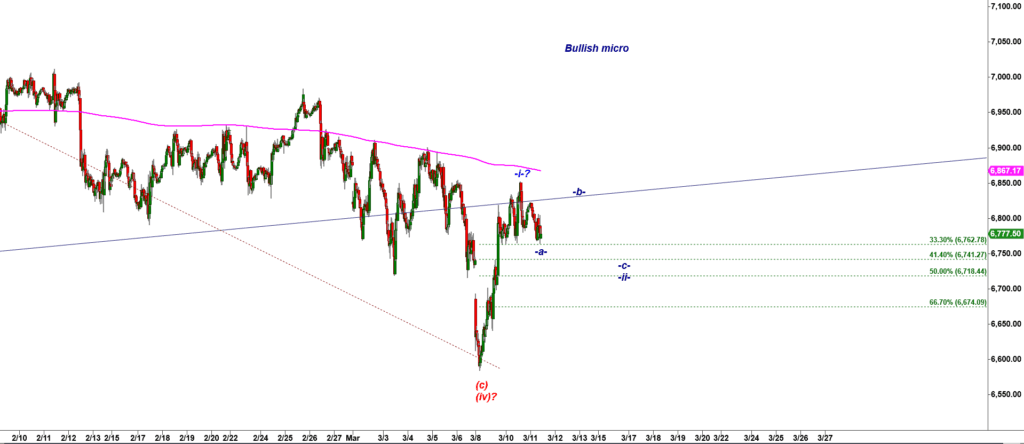
ES-mini 30 min chart
If the bounce was a micro wave -i- up, then the pre-market move down could be counted as a subwave -a- down pf a wave -ii- down. What makes a textbook -i- up, -ii- down long setup off a potential lasting low is an a-b-c corrective looking decline that follows the first impulsive looking rally.

posted at 11-07 AM
6,815 is a very important price level. That is a confluence of a monthly pivot and broken Yearly Support My new Tradingview indicator draws all major levels of support and resistance calculated on Weekly, Monthly and Daily timeframes.
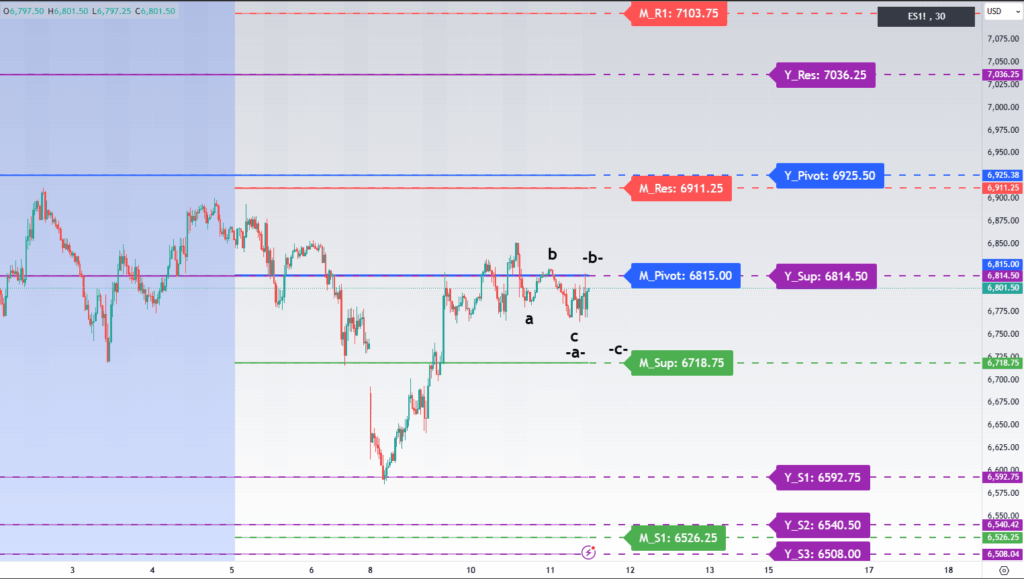
we are getting a flat a-b-c down consolidation along that important level of resistance.
That consolidation looks constructive for bulls because it builds a base right under the meaningful resistance. As long as bulls hold ES over the Green Monthly support 6,718.75 we can seriously consider that -a-b-c- down structure through the bulls’ lens. To confirm that ES did indeed make a lasting bottom on Sunday night we need bulls to close this week over the Yearly Support 6,814.50.