$ES #ES-mimi #WeekOpeningRange
Yesterday my new TradingView indicator calculated fresh Week Opening Range Levels and their extensions:
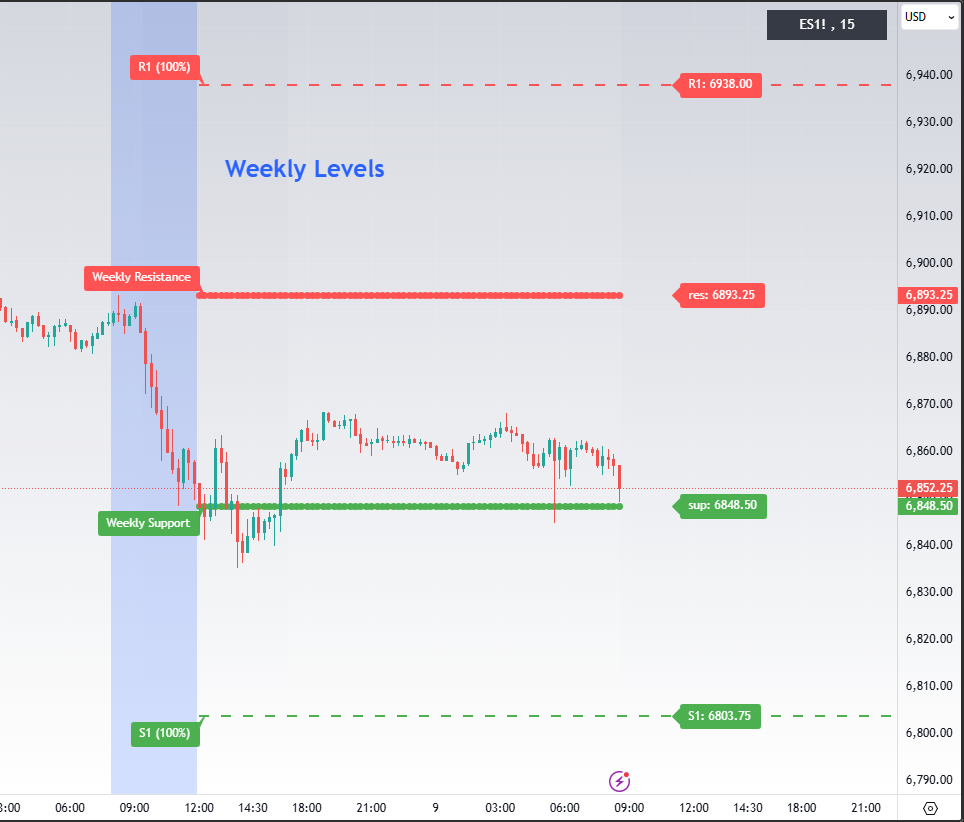
As you can see, right now ES-mini is testing the weekly support 6,848.50. Break under 6,848.50 would allows bears to push $ES down top the weekly support S1 = 6,803.75.
Now let’s review two alternative bullish wave count:
(1) The Less Bullish Wave count on a 30 min chart:
The market lost momentum in anticipation of the widely expected rate cut to be announced by the FED at 2.00 PM EST tomorrow on Wed. The lost bullish momentum works as an official invitation for bears to take over the party. However, we see very very weak selling this week so far.
To trigger that short term bearish scenario and confirm start of the subwave -c- of wave -ii- down bears need to break under the weekly support 6,848.50.
(2) The Very Bullish scenario.
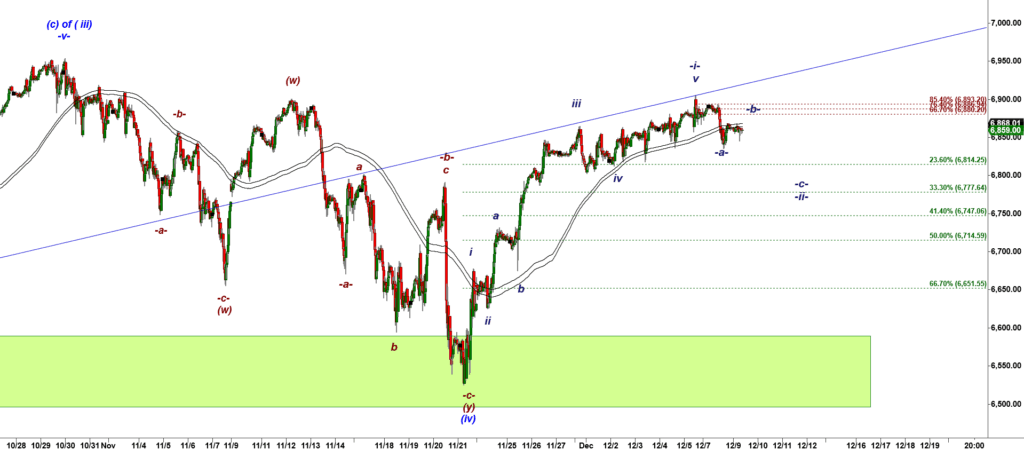
Bulls may argue that the quick drop we got yesterday was a subwave c of a wave -b- of -iii- down shaped as a very bullish Running Flat corrective structure:

ES-mini 120 min chart
That complete looking super shallow corrective structure allows bulls to play a breakout over the Monthly Resistance and start an accelerated rally in a suwbave -c- of wave -iii- up.
Bulls need to push ES-mini over 6,893.50, the weekly resistance to trigger the Very Bullish scenario.