$ES #green_zone #bulllish_reversal
On Tuesday and Wednesday I warned you that the corrective structure looked complete and Bulls had a setup to start a new five wave up rally. The market just waited for a trigger to break over resistance. And NVDA results gave the market a spark it needed to break over resistance
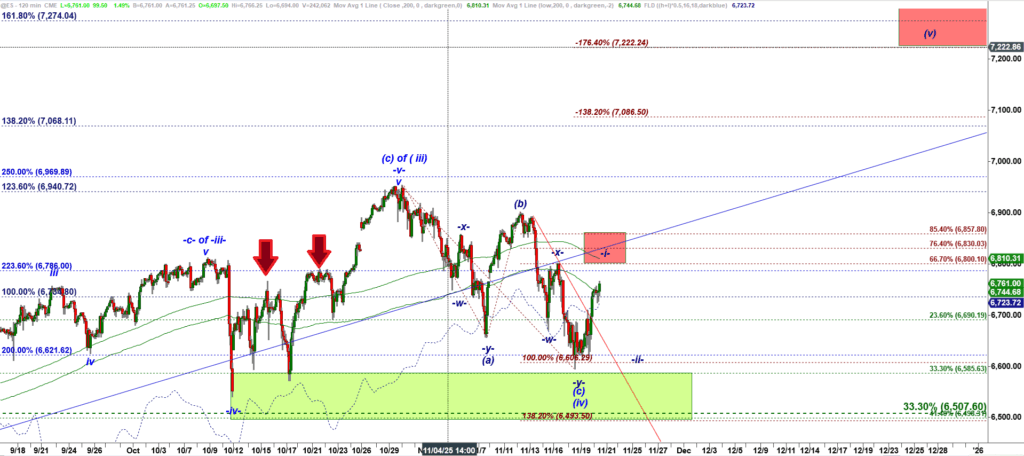
ES-mini 120 min chart
On Wed morning I noted:
…”What can make me conclude that ES might have bottomed? I would require bulls to reclaim the broken weekly support 6,715“
This week I published my brand new indicator, Weekly Opening Range. That tool has turned out to be a great success. Look:
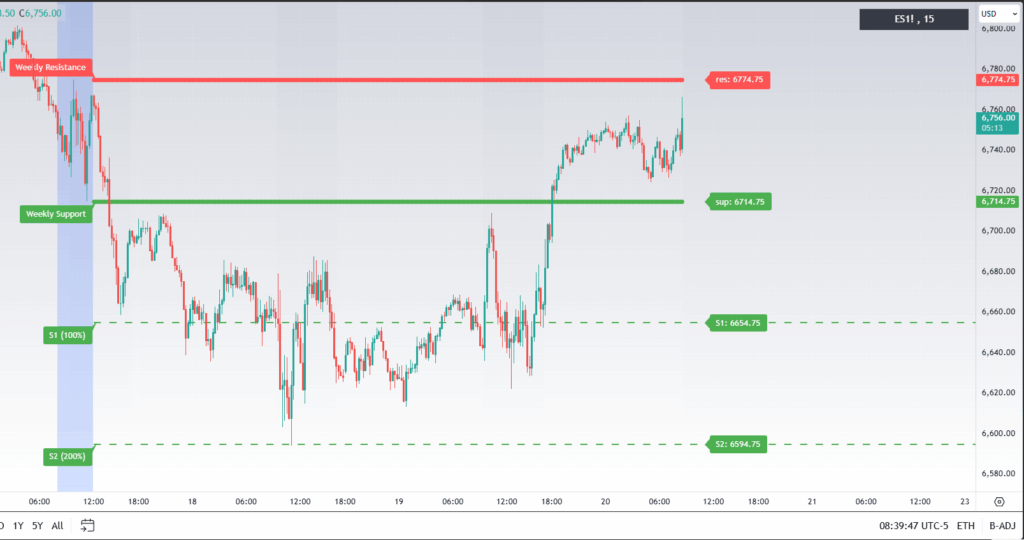
The idea behind that trading strategy is to measure the trading range formed in morning hours of Monday and trade in direction of a breakout.
When ES crossed under the green weekly support 6,714.75 we expected bears to test the S1 level 6,654.75.
When price bounced up off the S1 level and came back up to the broken weekly support 6,714.75 but bulls failed to reclaim it, we expected next another trip down to S2 level.
Note how S2 level perfectly caught the bottom this week!
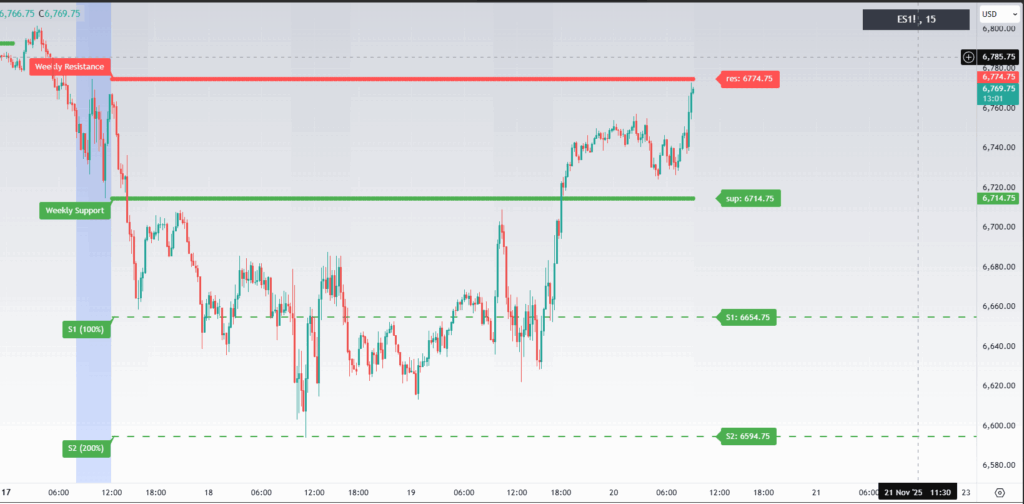
Yesterday at close I posted for subscribers of my Premium Chat room an update saying that the fact that bulls reclaimed S1 and then managed to stop a bearish pullback OVER S1 gave a bullish signal.
And while I am typing this update ES has approached the red Weekly Resistance 6,775.
Essentially ES came back to where it started the Monday! That essentially means that all teh bears who went short on the move down on Monday – Tuesday got trapped:
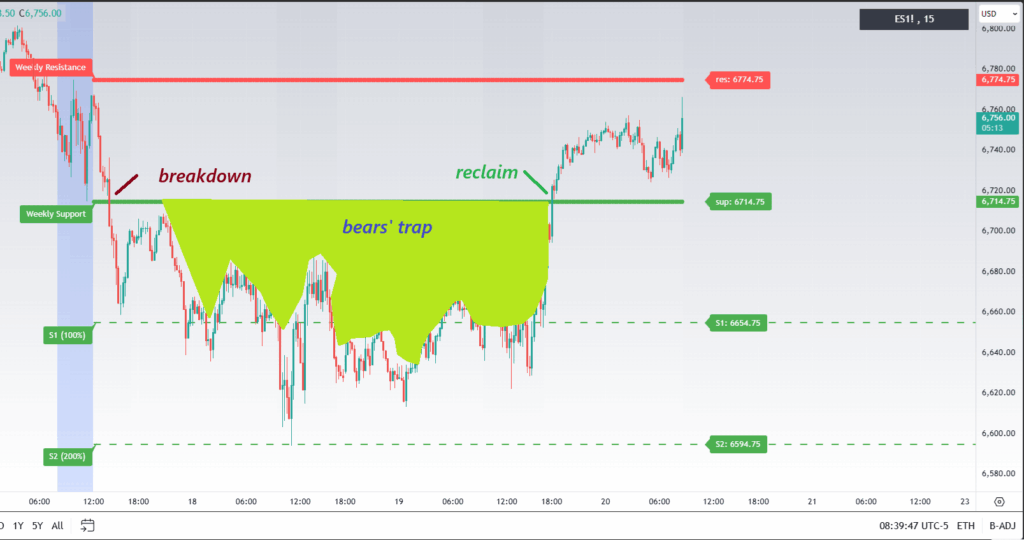
Now ES approached a resistance band that starts with 6,775, the Weekly Resistance and goes up to 6,800. Bears turned ES down off 6,800 level many times. We can count the move up as a micro wave -i- up that should be followed by a corrective wave -ii- down.
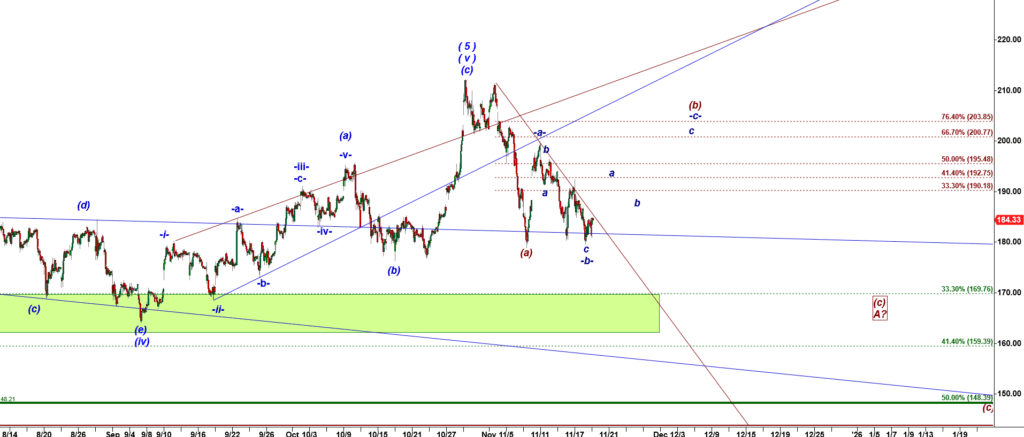
BONUS: NVDA
Yesterday morning at 9:16 AM EST I posted in my Premium Chat room a bullish outlook for upcoming earnings:
“Bulls have a good setup to produce a corrective move up in a subwave -c- of wave (b) up.
192.50 is a key resistance for that bounce. In the worst case scenario, bears may stop the bounce at 192.50 and turn NVDA down starting another big leg down. In a bullish scenario, the 192.50 resistance will only produce a shallow pullback and then will be followed by the second micro leg up to 195.50 with potential extension up to 200.50.“
NVDA 30 min chart
Note how well the Weekly Levels help to navigate the market moves:
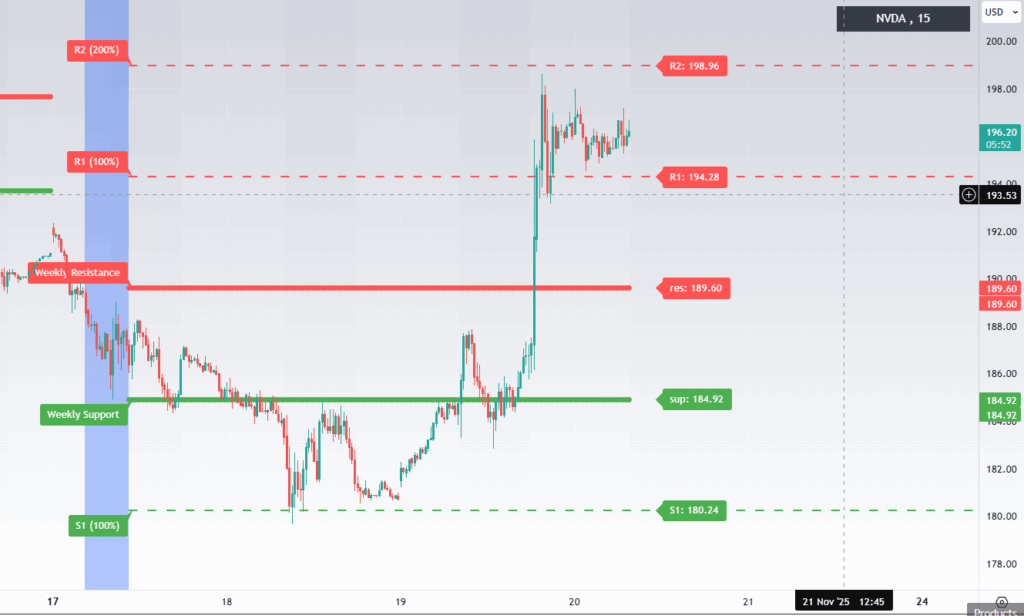
Rally in NVDA spiked up to R2 weekly level of resistance 198.96.