$ES #ES-mini #a-b-c down pullback
Yesterday I shared a new macro count. The market invalidated the Very Bullish wave count and I had to find a viable alternative:
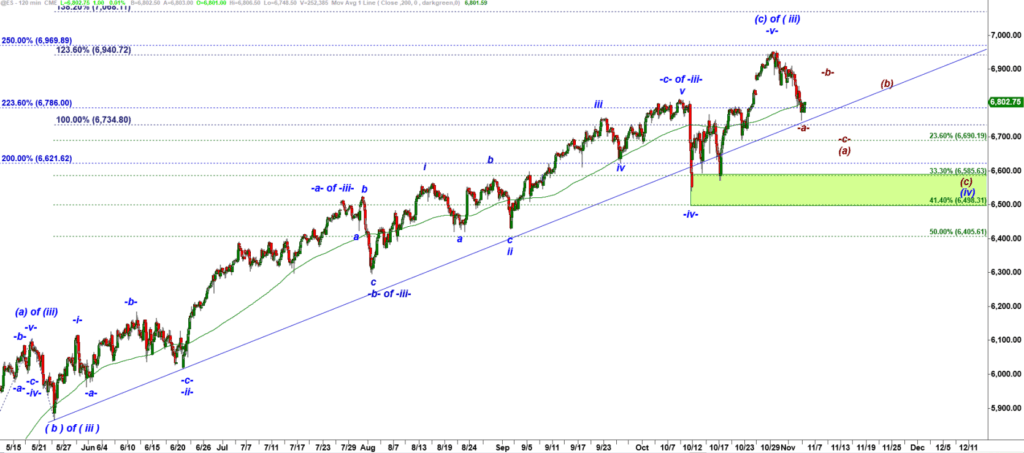
ES-mini 120 min chart
That alternative count still looks bullish long term in a sense that it allows bulls to resume rally upon completion of this (a)-(b)-(c) down corrective structure.
Zooming in to a 15 min chart:
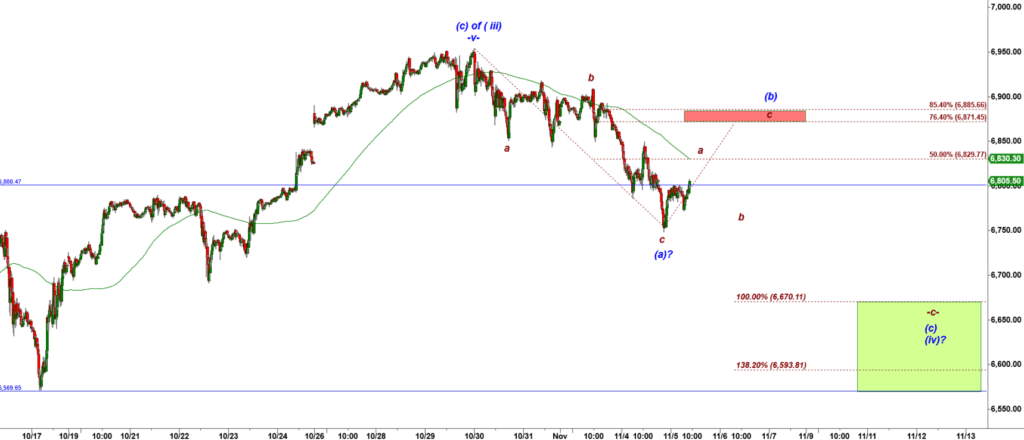
ES-mini 15 min chart
I combine Elliott Wave counts with signals and levels of support and resistance calculated by my proprietary TradingView indicators.
My most post powerful preferred tools are Cycle Trader indicator and Impulse Master Indicator.
For example, Impulse Master indicator printed a fresh green demand zone in ES-mini:
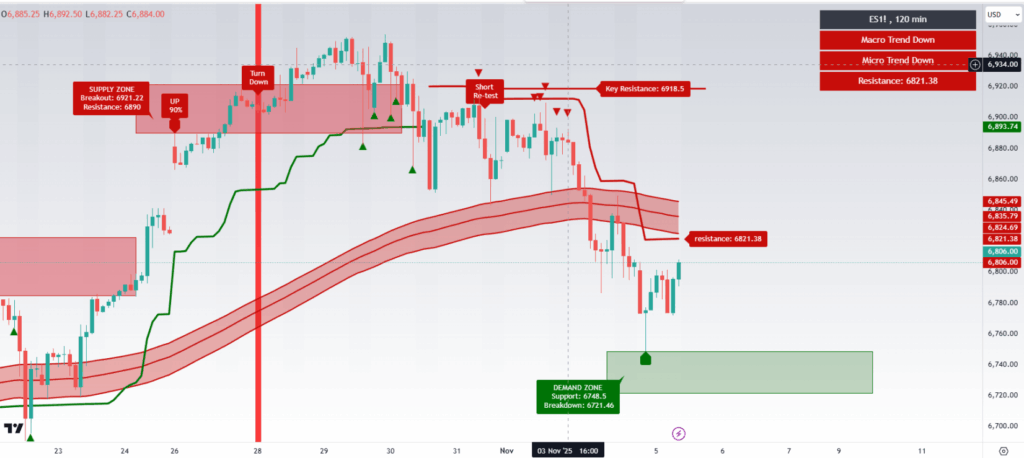
ES-mini 120 min chart
…and a fresh green demand zone in ETHUSD:
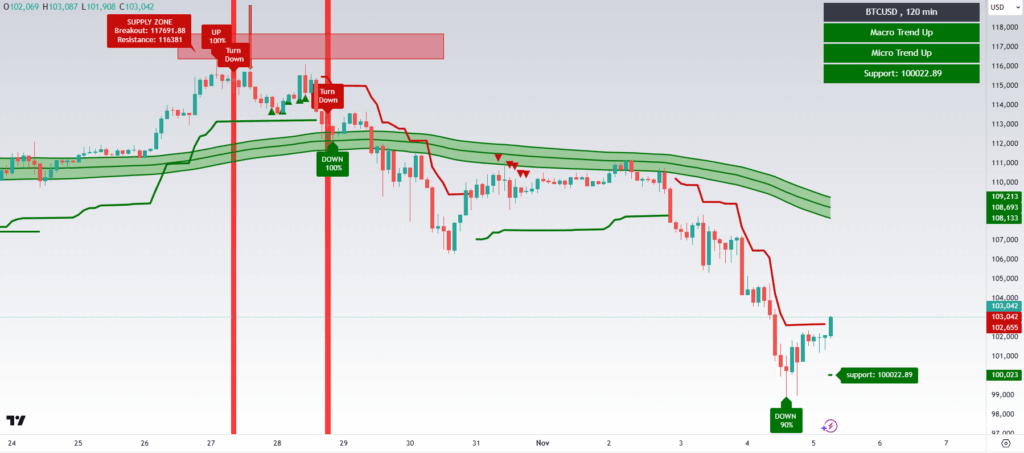
ETHUSD 120 min chart.
The Cycle Trader indicator calculates key micro and macro levels of support and resistance:
ES-mini has bottomed at the weekly support 6,748 pre-market:
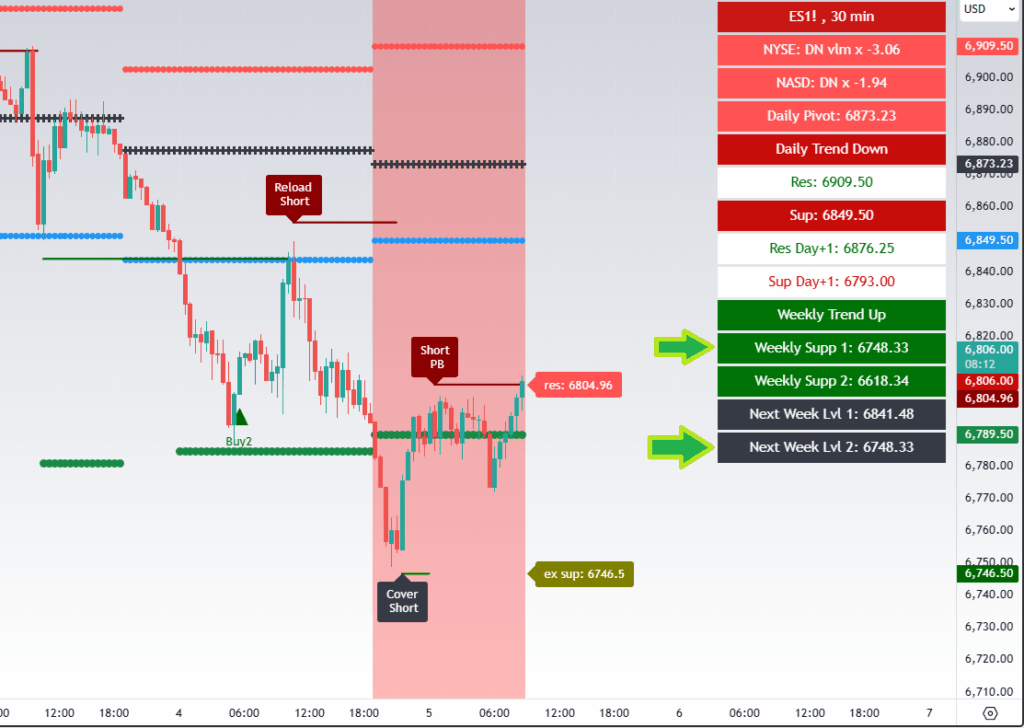
ES-mini 30 min chart
The key resistance for today is the broken blue Daily support 6,849.50.