$ES #ES-mini
Yesterday I warned that break under the key micro support 6,866 would make me taking all the bullish bets off. That support got broken yesterday.
Almost always first three trading days of a new month brings back heightened volatility. This pattern is being played this week.
When a key support gets broken invalidating the very bullish scenario we need to recount the whole wave count.
The last major low was made in oct 2022. I count that low as the bottom of a wave 4 down.
Then we should count an A up, B down, C up structure of the final wave 5 up off the Oct’2022 low:
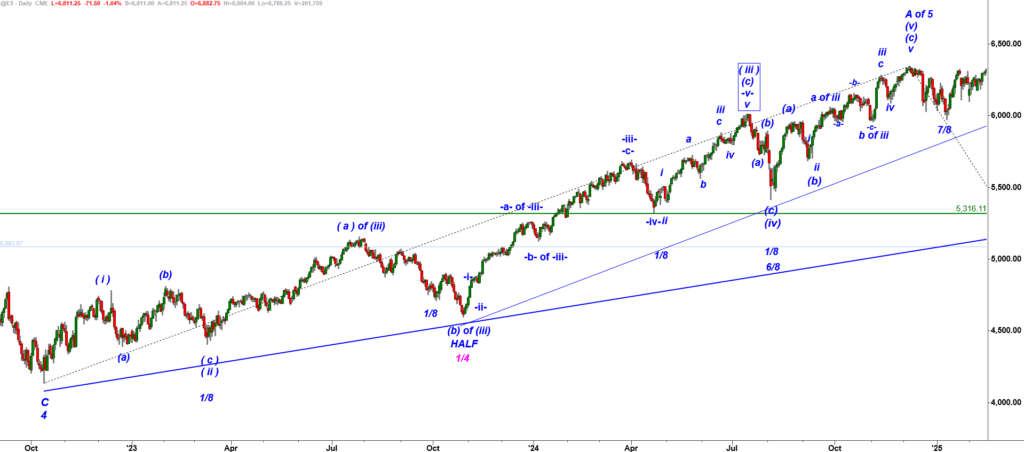
ES-mini 120 min chart
We counted relatively clean five wave up rally that topped in Dec 2024.
We label that rally as A of 5.
Then we got a strong three wave drop that bottomed in April 2025:
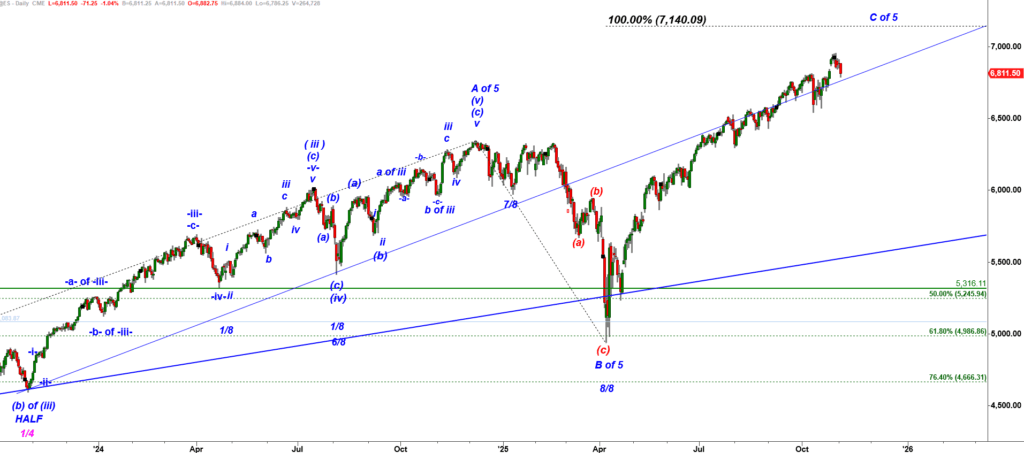
ES-mini 120 min chart
We count that drop as a subwave B down of wave 5 up. That drop retraced 61.8% of the preceding rally A of 5. And, off the April 2025 bottom we got a super strong exhaustive rally in a subwave C of wave 5 up. Quite often, the final squiggle of a large five wave up structure, the subwave C of wave 5 up, comes as a strong short covering rally behaving as strong as the strongest segment of the five wave up structure, the subwave C of wave 3 up. It sucks in all the retail traders who sit on the sidelines for months. Now the challenge is to count micro waves inside the rally off the April 2025 low.
It is really difficult to argue, that we can call the structure of a five wave up rally off the April 2025 low completed:
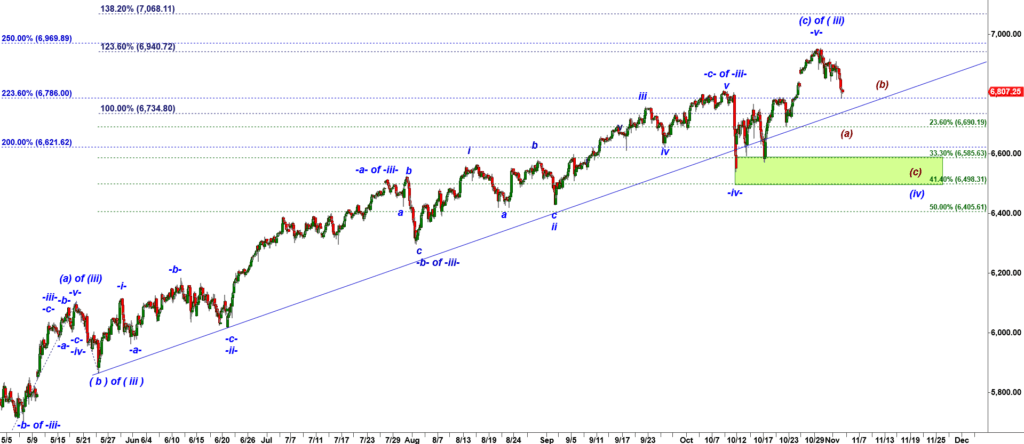
ES-mini 120 min chart
The best micro count I can get argues that ES-mini might have topped in a micro wave ( iii ) up and started a corrective (a) down, (b) up, (c) down structure of a corrective wave ( iv) down.
The wave (iv) down is supposed to find support in the Green Box, retracing from 33.4% to 41.4% of the last completed five wave up structure in (c) of ( iii ) up.
That wave count allows bulls to produce another leg up after completion of that (a) down, (b) up, (c) down corrective structure.