$ES #ES #short setup
Bears turned trend down both on Daily and weekly timeframes:
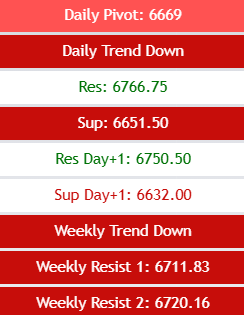
These levels are calculated by my proprietary Cycle Trader Indicator for TradingView.
Send me email to castawaytrader@gmail.com if you want to get a trial.
The drop overnight failed to break under the low made by the first leg down in a wave ( a ) down. Then we got a quick push back up, a typical short squeeze. The bearish scenario is that the overnight drop completed a wave -w- down and the pre-market rally is a corrective rally in a wave -x- up.
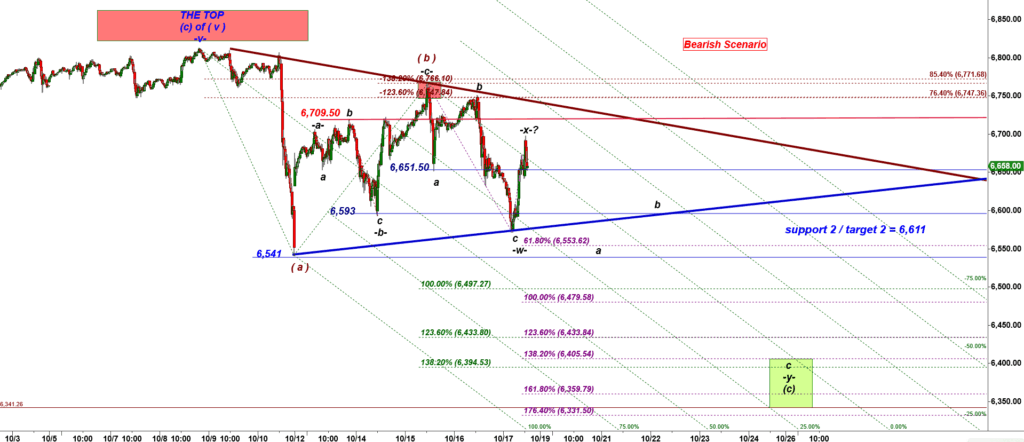
ES-mini 15 min chart
This morning Bulls are struggling at the key resistance of the black daily pivot 6,669. Failure to break over that level could be followed by a drop down to the Green Secondary support 6,536.
There is a low probability alternative triangle scenario:
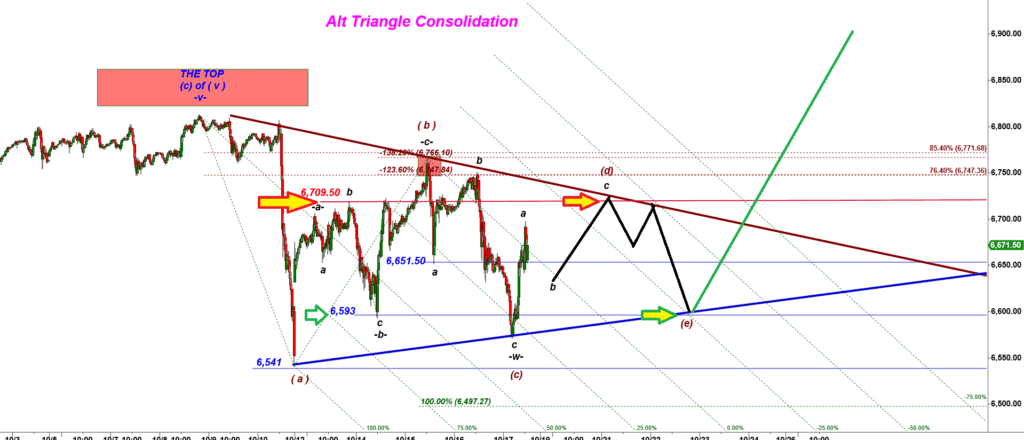
ES-mini 15 min chart
Under that triangle scenario I expect the weekly resistance 6,711.75 to stop the subwave (d) up.
Essentially the triangle scenario argues that the market is in some equilibrium state and Es will continue to oscillate between two converging trend lines. But that scenario is macro bullish because a completed triangle shaped consolidation should be followed by a bullish breakout.
So we can see two key levels:
- resistance 6,711.75, and
- support 6,593.
We need either bulls to break the resistance or bears to break the support to start another trending move up or down.
Reminder: Join my free Telegram channel to get instant notifications on new posted updates!