$ES #ES-mini #Elliott Wave
Under the very bullish wave count we are supposed to get a flat -a-b-c- down consolidation in a subwave b down of wave iii up:
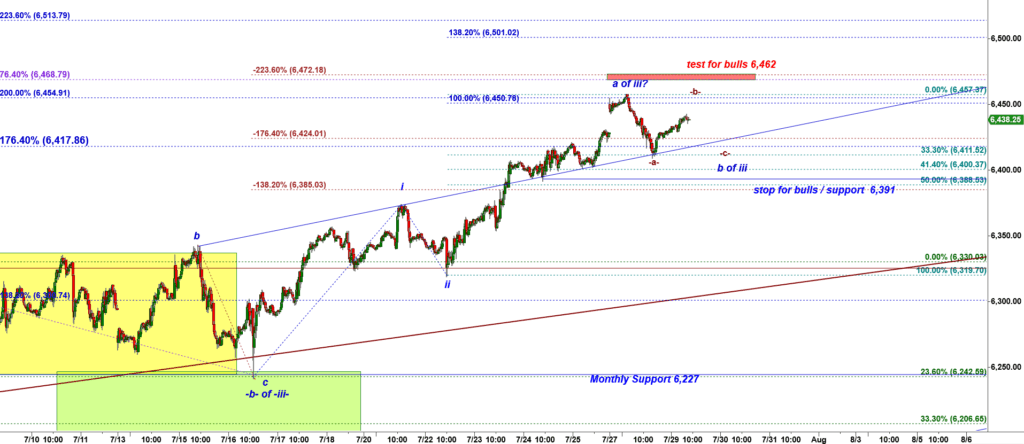
ES-mini 15 min chart
Yesterday evening decline stopped right at support of the blue trend line that connected two previous peaks. So that was the textbook pattern / setup when a broken resistance turned into support.
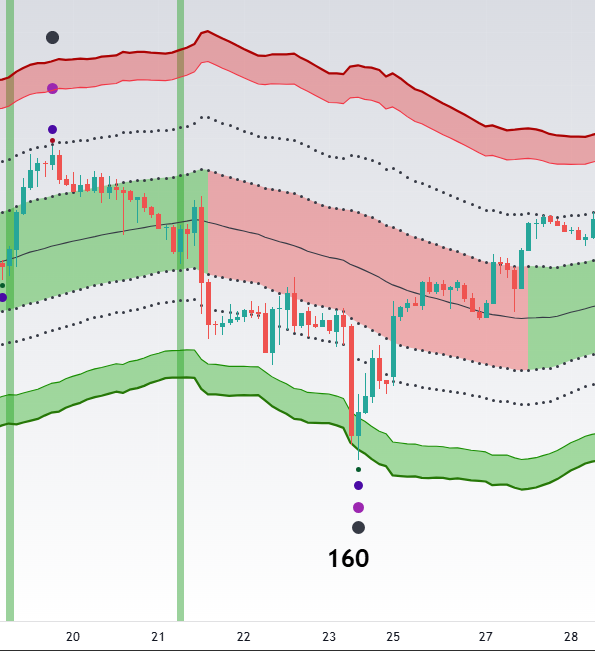
My brand new Channel Pro indicator draws support an resistance lines and helps to identify cycle troughs and peaks. As I noted yesterday cycle analysis argues that ES worked on a 160 / 80 period trough to be made in coming days. Yesterday I concluded that …***”we expect a trough to be made on the night from Tuesday to Wednesday or pre-market Wednesday..”***
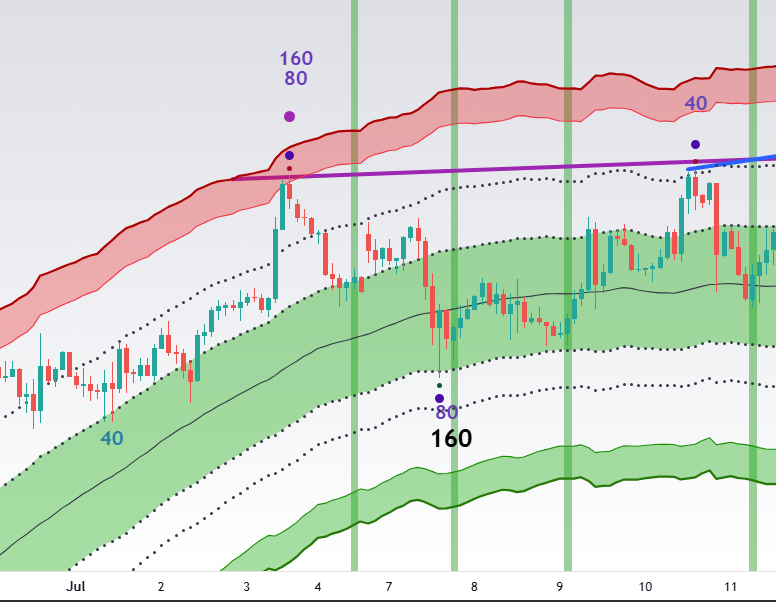
Three previous 160 period troughs in ES-mini tested the bottom of the Green Trend Channel drawn by my brand new CAT Channel PRO indicator:

The 160 period trough in Late May:
in mid June:
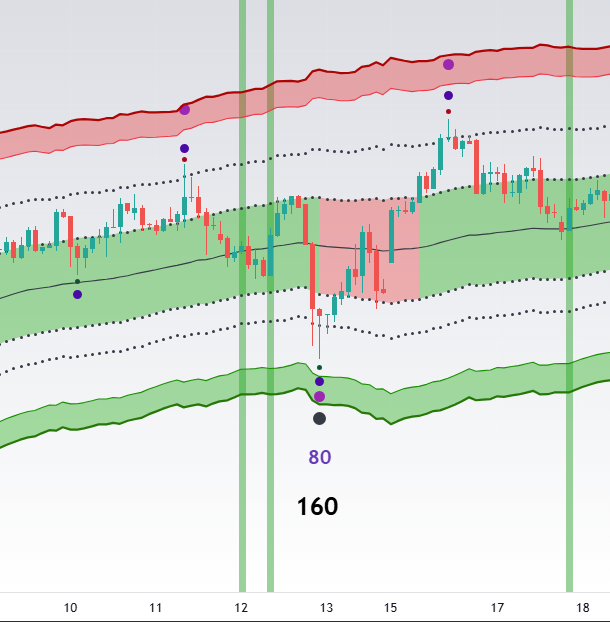
in early July:
But now ES has NOT tested the lower boundary of the green channel yet:
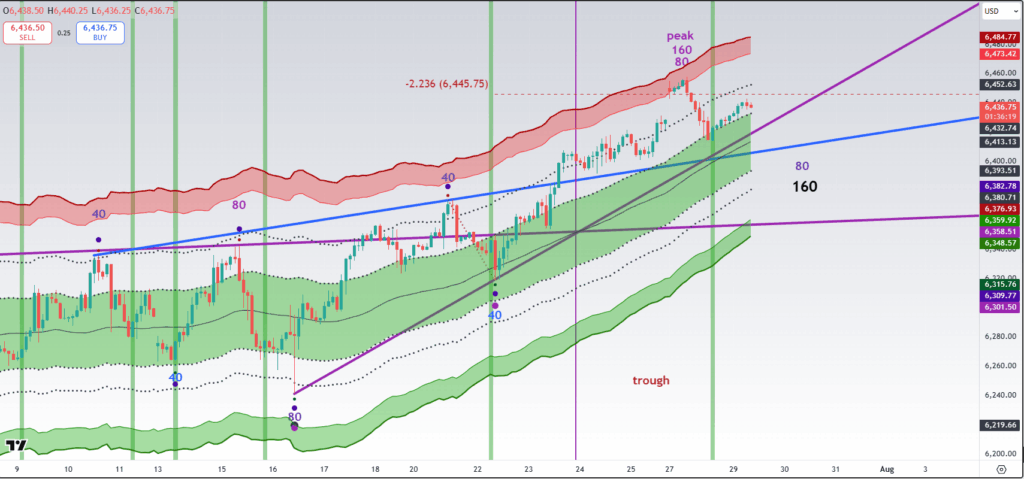
ES-mini 120 min chart
So I conclude we can get another push down slightly under 6,400 to make that 160 period trough.

posted at 2-48 PM EST
So we have got a perfect looking corrective a-b-c down zig-zag that could be counted b down of wave iii up:
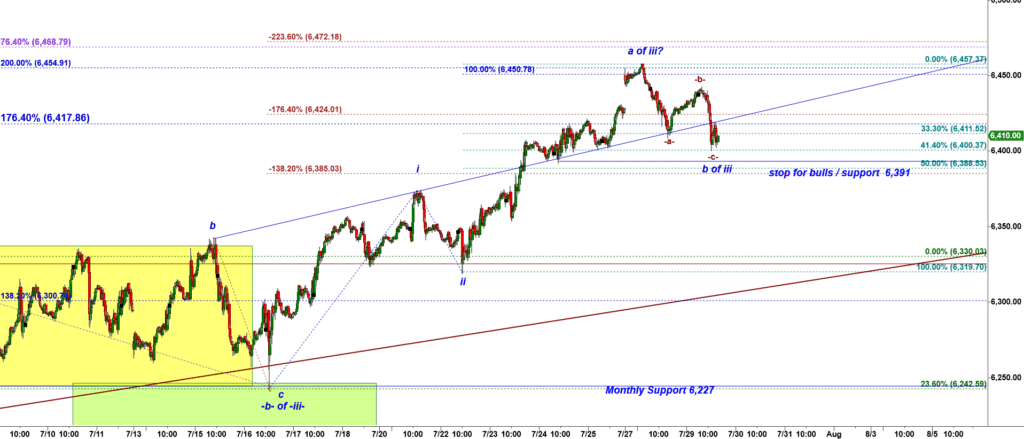
ES-mini 15 min chart
That is a setup for bulls to start another leg up in a subwave c of wave iii up.
I keep looking at the trend channel drawn by my brand new Tradingview indicator called CAT Channel PRO:
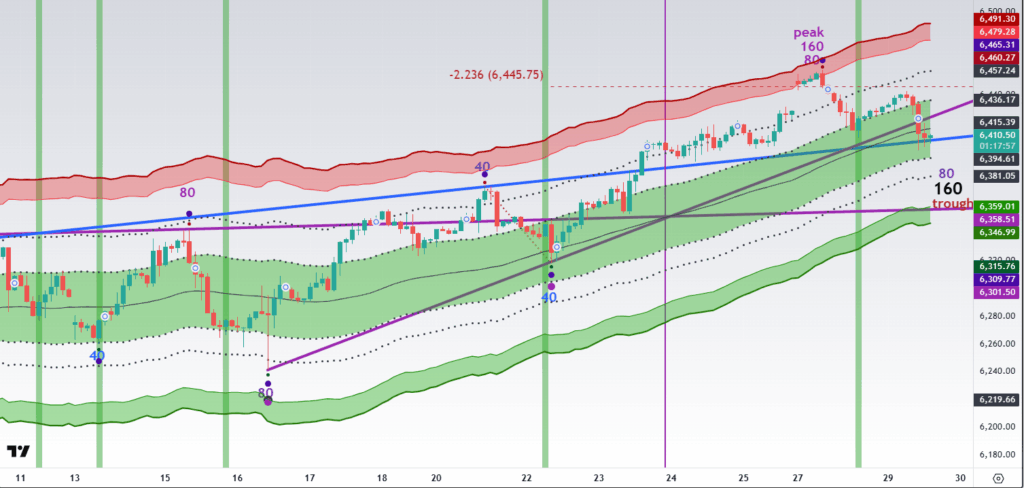
ES-mini 120 min chart
Support of the Green Channel is 6,394.