$ES #es-mini #ElliottWave #breakout #failed breakout
We’ve been closely monitoring a Very Bullish Scenario that could be triggered by a decisive break above the Monthly Resistance at 6,333.
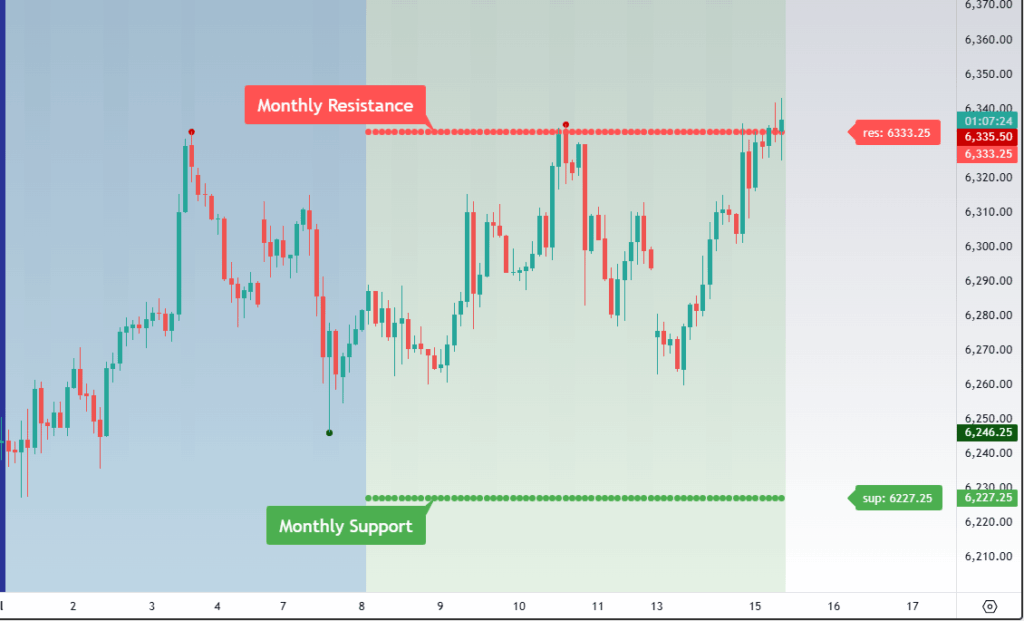
ES came back up to the Monthly Resistance 6,333. Break over that level confirms intramonth bullish trend.
This is the Very Bullish path we have been watching:
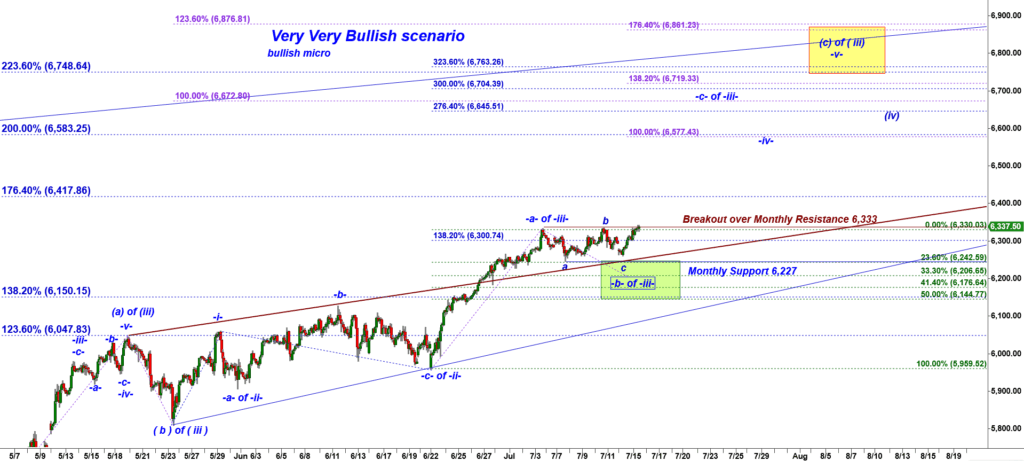
ES-mini 120 min chart
📈 Zooming In:
When we zoom into the recent price action, a key resistance level becomes evident:
➡️ 6,360 stands out as a critical threshold. It aligns with the -138.2% Fibonacci extension of the prior corrective decline—typically a textbook target for a wave b up in an a–b–c corrective structure.
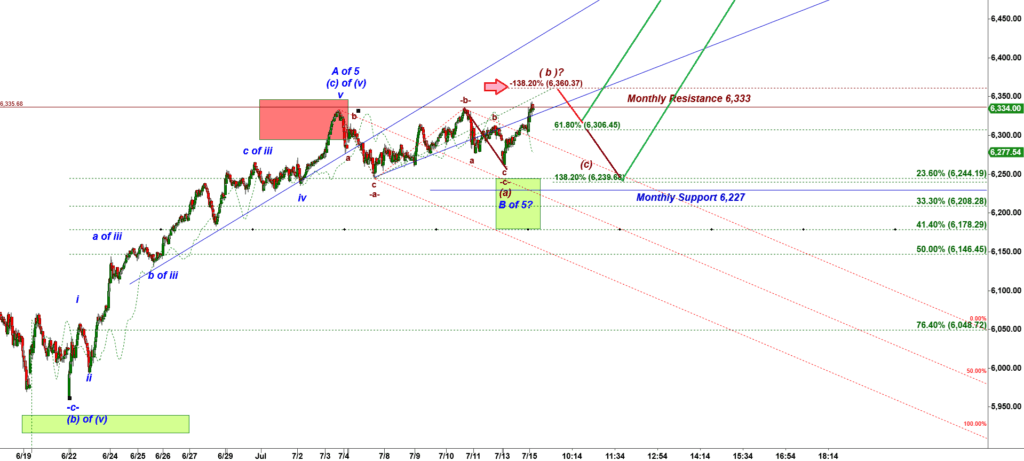
ES-mini tick bar chart
Even within a corrective move, wave b up can often reach a higher high, especially in a strong uptrend. The big question now:
Is this move part of a corrective b wave, soon to be followed by a drop in wave c?
Or is this the beginning of a new, powerful leg higher?
🔍 Step 1: Watch the 6,360 Reaction
If bears reject the rally at 6,360, we should expect a pullback below the Monthly Resistance at 6,333. That failure of bulls would attract many short sellers and would create a bull’s trap.
Remember the textbook breakout-followed-by-retest pattern. If ES comes back down to 6,333 or slightly lower that would NOT jeopardize the bullish scenario.
⚠️ Step 2: Two Key Support Scenarios if Rejection Occurs
Scenario i — Failed Breakout Retest (Bullish Setup):
- Watch for support at 6,306.50.
- If bulls catch the dip there, reverse it, and reclaim 6,333, this would set up a high-probability long trade—a classic “failed breakout turned bullish continuation” setup.
Scenario ii — Expanding Triangle Trap (Bearish Trap or Shakeout):
- The trickiest case would be a deeper drop that extends to 6,240, undercutting the prior low at 6,247.50.
- This would potentially complete an expanding triangle—a pattern that often catches both bulls and bears off guard.
Stay focused and flexible. The price action near 6,360 and how the market responds to any rejection will be critical to map the next high-probability trade.

One could note that ES formed a bullish inverse head and shoulders structure that needs to get triggered by a push over 6,333 neckline:
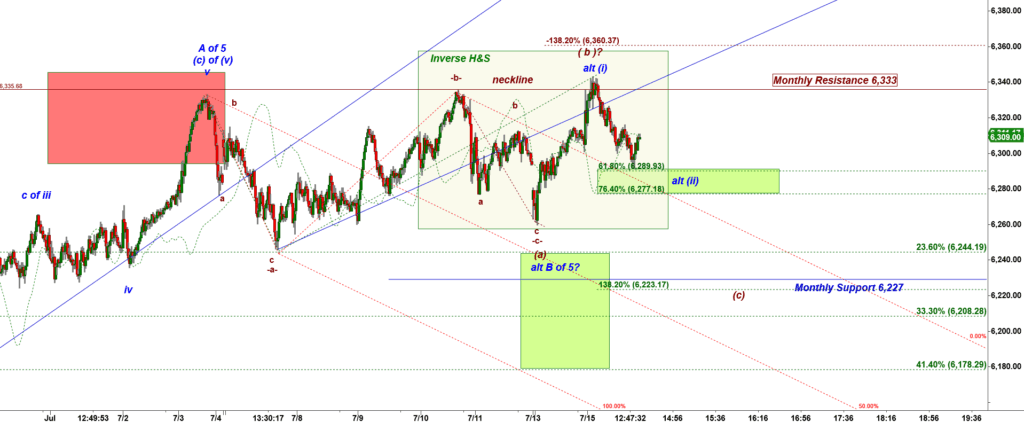
ES-mini 13,500 tick bar chart
So far bulls stopped the decline at the very first support 6,290.
That is a decent long setup for the real breakout over 6,333 Monthly Resistance.
A safe approach to trade this is to wait for a break over 6,333. A risky approach is to go long here and set a stop under 6.290.
Bulls consider that whipsaw as (i) up, (ii) down long setup, a starting point of a new big rally in a subwve C of wave 5 up.