$ES #ES #Elliott Wave
On Sunday evening bears manage to make a new lower low.
In October 2022 ES-mini produced a very similar “three drives down” corrective pattern that made a major low:
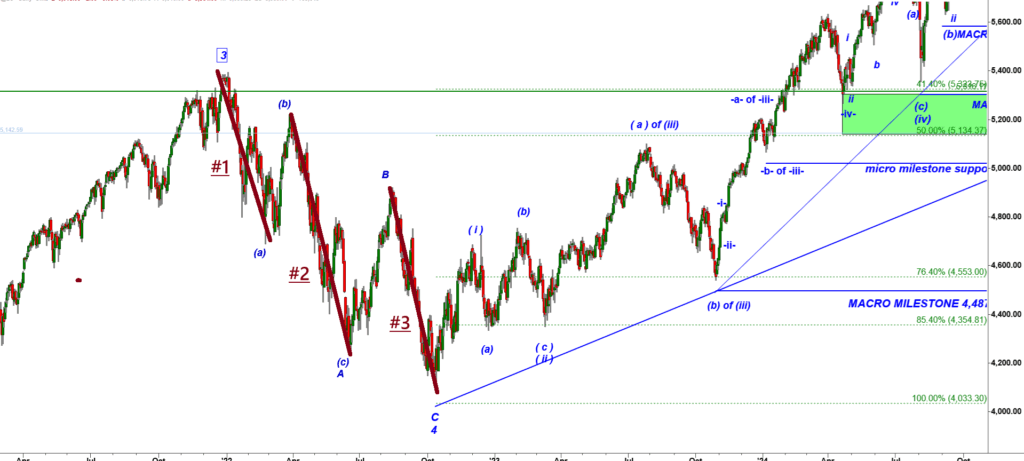
ES-mini Daily chart, 2022
You can see three overlapping legs down that made a major bottom in Oct’2022.
And you can see similar three drives down made by ES-mini in June 2025 (see the chart below).
Because the Sunday drop made a lower low we can count that Sunday low as the Bottom of the subwave B of wave 5 up, a starting point of another five wave up rally in a subwave C of wave 5 up:
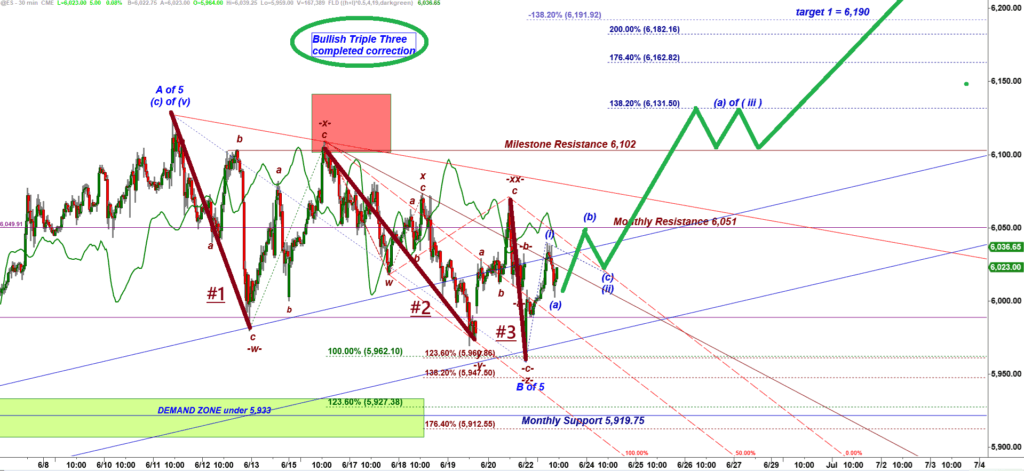
ES-mini 30 min chart

posted at 12:20 PM EST
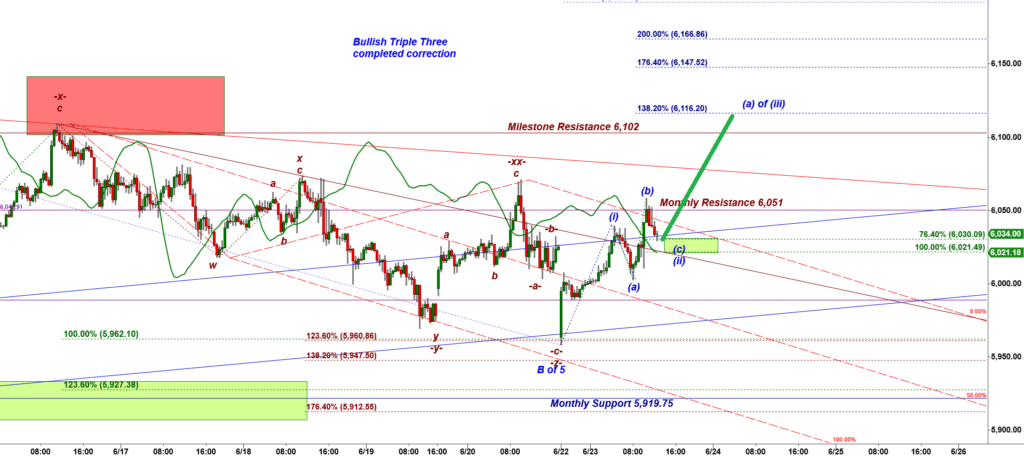
ES-mini 30 min chart
ES-mini has been following our bullish path.
By that moment we got a wave (i) up followed by a corrective (a) down, (b) up, (c) down structure of the wave ( ii) down shaped as a very bullish Running Flat structure.
Here bulls got a decent long setup to start a subwave (a) of wave ( iii ) up targeting 6,116.
The immediate resistance is 6,040. You can wait for that level to get breached before going long.