$ES #ES #trading setup #Elliott Wave
We got a corrective three wave decline that almost hit the Green Box:
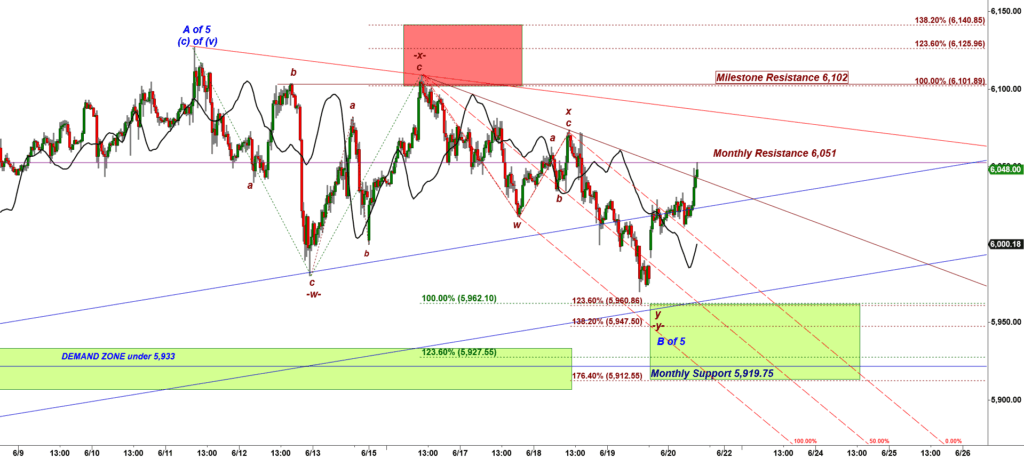
ES-mini 30 min chart
ES reclaimed the Daily support 6,017. The picture looks bullish.
That consolidation built a base for another push higher.
Let’s look at the big picture on a daily chart:
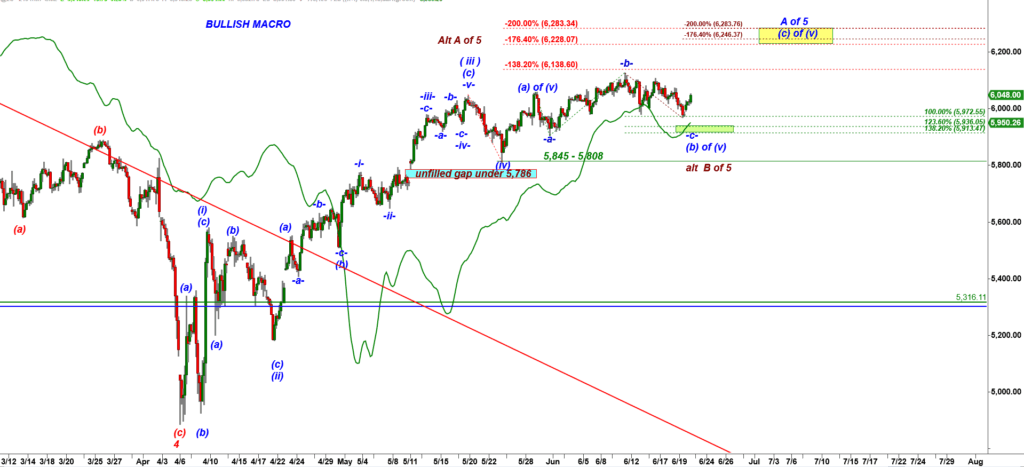
ES-mini Daily chart
This move up could be a micro wave i up out of the expected five wave up structure targeting 6,228 – 6,246.

posted at 11-15 AM EST
ES spiked up to the Daily resistance and then got sold:
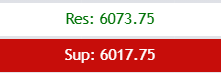
The Daily support and Daily resistance levels are calculated by my Cycle Trader indicator.
In the course of the micro wave i up price breaks over the FLD (black line) and then comes back to re-test the FLD from above:
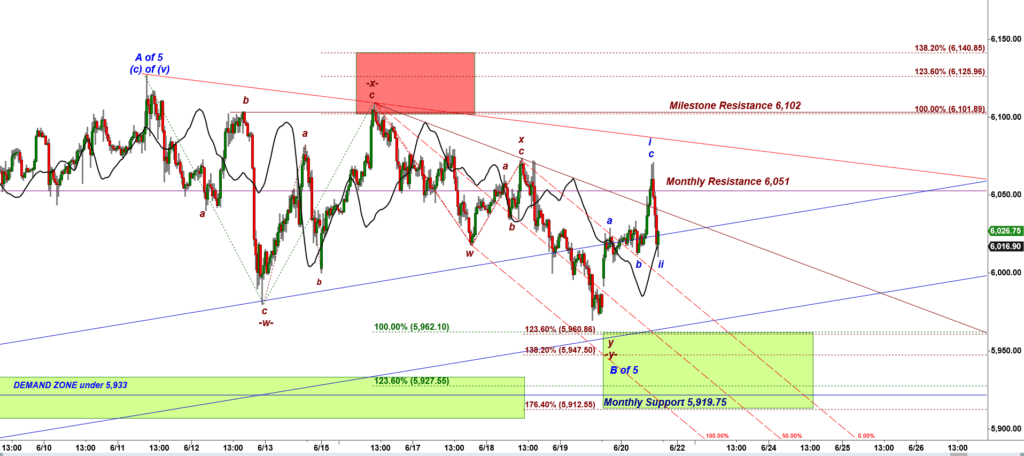
ES-mini 30 min chart
That bullish i up, ii down setup is valid as long as bulls hold ES over the Daily support 6,017.