$ES #ES-mini #Elliott Wave
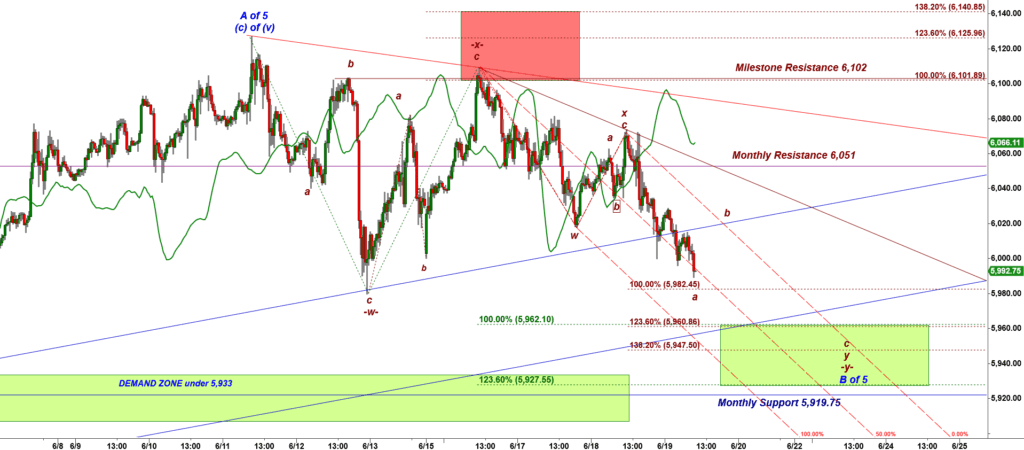
Today the US stock market is closed. Let’s review the overnight decline in ES-mini futures. ES futures have been following the red path down we discussed yesterday.
Let’s discuss two two bullish macro interpretations of the rally off the early April’25 low.
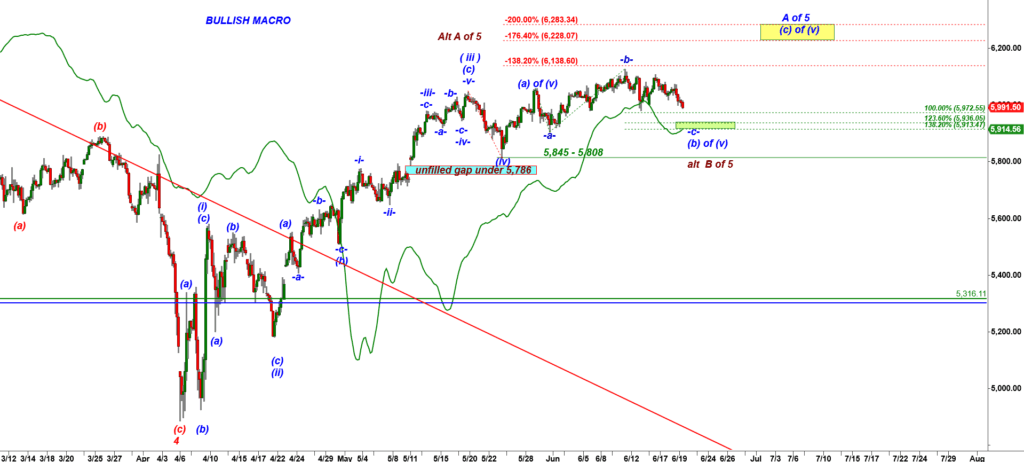
ES-mini Daily chart
The first wave count considers the top made at 6,045.75 on May 19 as a wave ( iii ) up.
Under that wave count the wave ( v ) up has not topped yet.
This slow moving decline could be counted as a subwave (b) down of wave ( v ) up.
The second wave count assumes that the May top was the top of the subwave A up and this boring flat consolidation is a subwave B down.
I have added the green line, the 80 period FLD. You can see that price broke out over the green FLD in late April. Now price comes back down to that green FLD to test it from above. Note that the Green FLD is currently located at the Green Box.
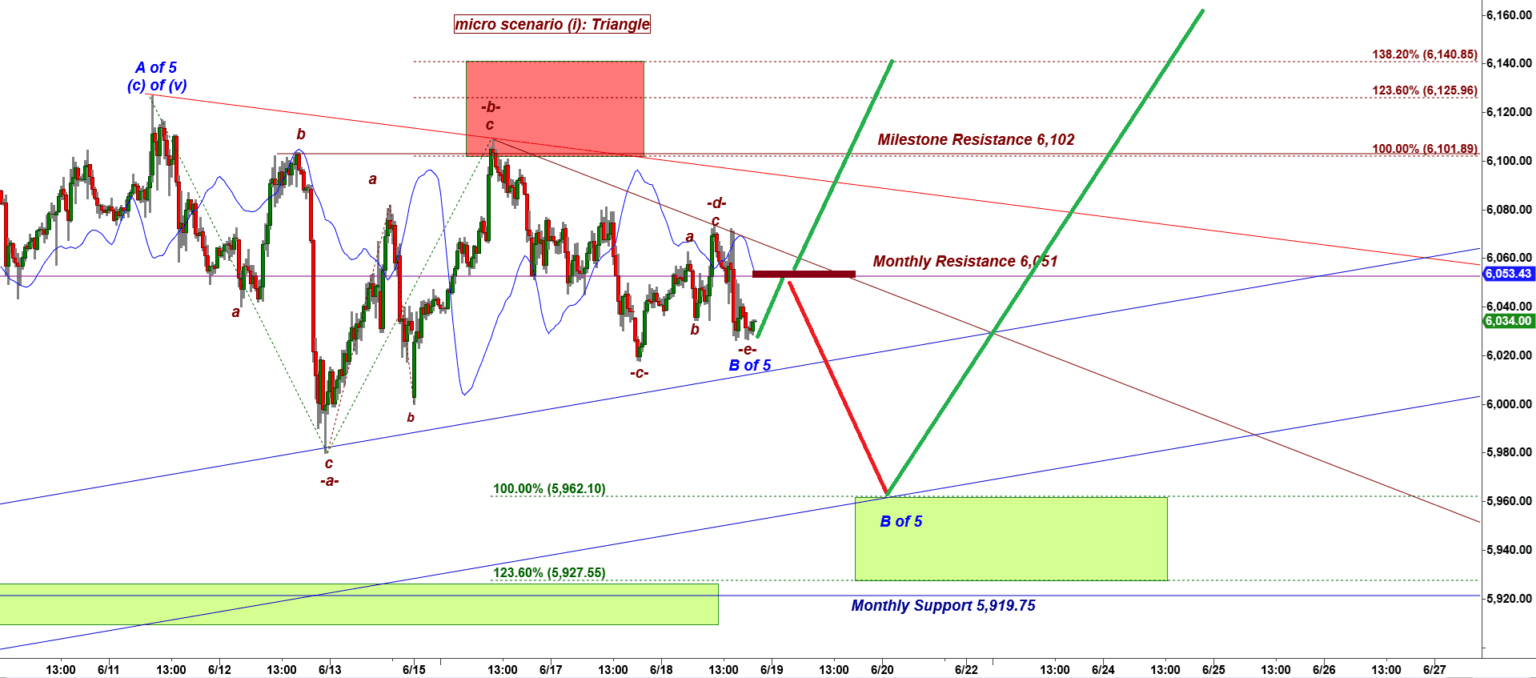
Let’s zoom-in to a 30 min chart:
ES-mini 30 min chart
It is possible to count the morning lows at the 100% ext (5,982.45) as a subwave a down to be followed by a bounce in a micro wave b up.