$ES: Macro Update & Gann’s Levels

  • CastAwayTrader
  • November 26, 2023
<<< Back to All Updates
<<< Macro Updates

$ES #ES #Macro #Trading Setup

Let’s first look at the daily chart of S&P cash index:

SPX Daily chart

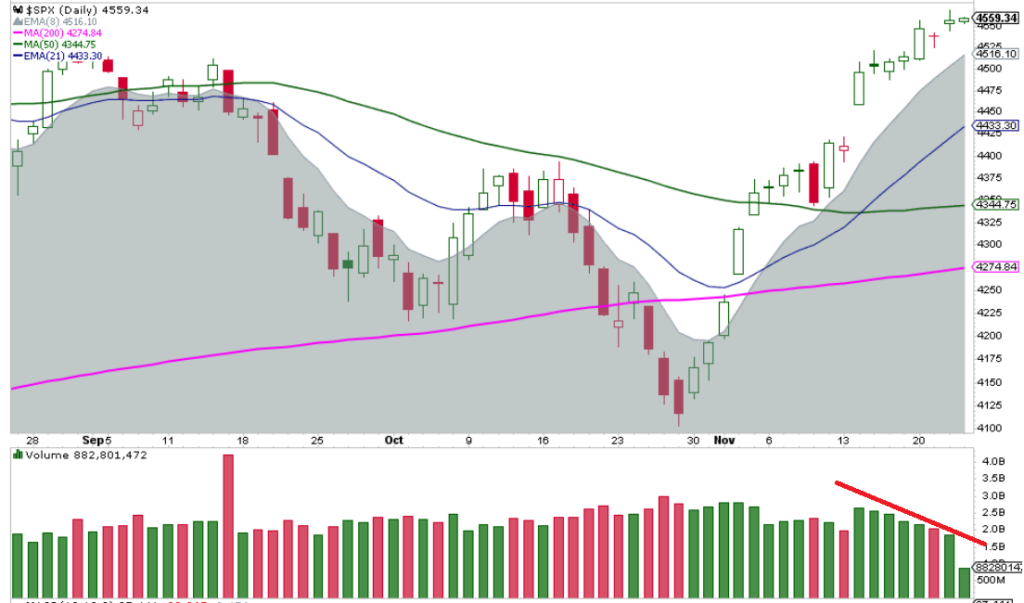
The last three trading days have been small doji candles. That is contraction in volatility.

Most likely it will be followed by expansion in volatility.

Now note well established down trend in daily volume. This rally kept pushing up on fumes.

Now let’s get back to the two primary macro scenarios / wave counts we have been watching:

(1) the bullish scenario:

ES-mini Daily chart

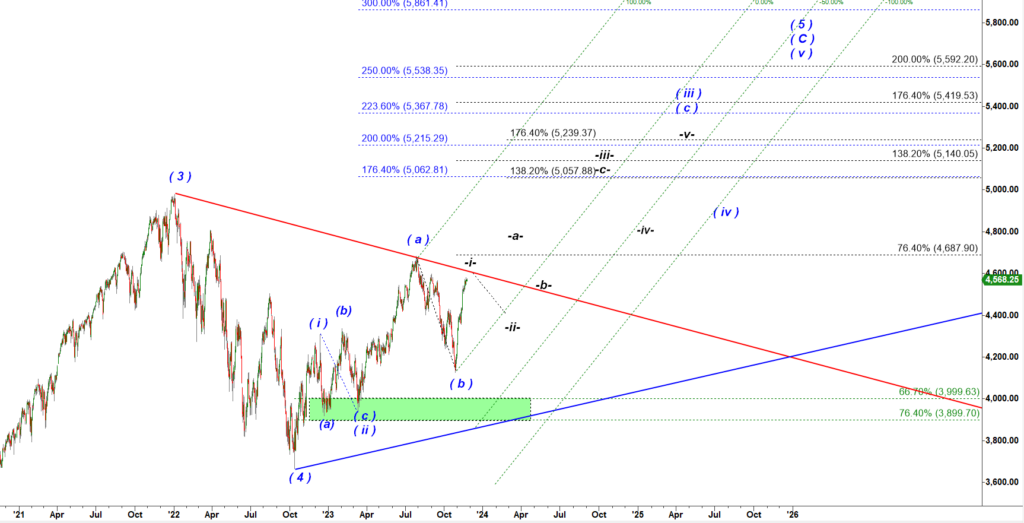
Bulls consider the Nov’23 rally as a micro wave i up. Then we should get a corrective wave ii down before the next leg up in a subwave a of wave iii up.

( 2 ) the bearish scenario / wave count:

ES-mini Daily chart

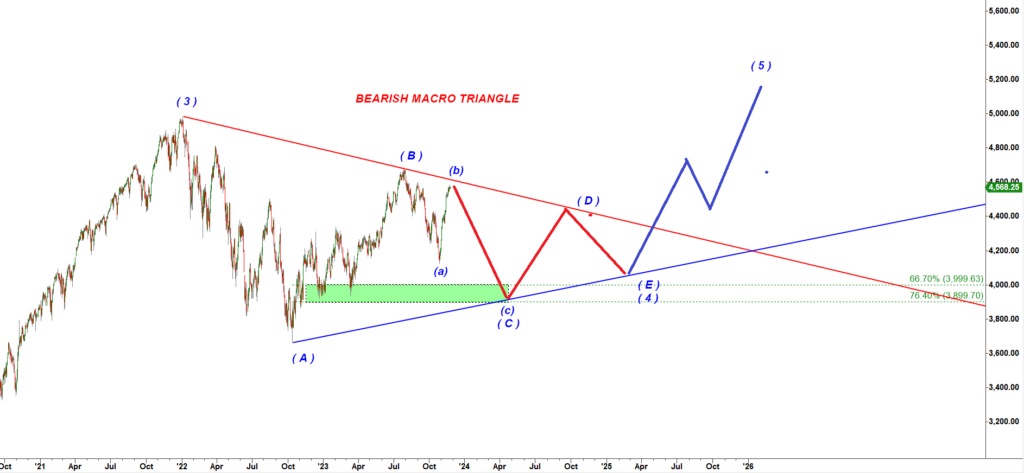
Under the triangle scenario the Nov’23 rally was just a corrective subwave (b) up to be followed by a very strong drop in a subwave (c) down. Interestingly, here ES hit a high that is 360 degrees/days away from the Nov’22 high.

On a micro scale, we can attempt counting the November rally as an unfinished five wave up move:

ES-mini 120 min chart

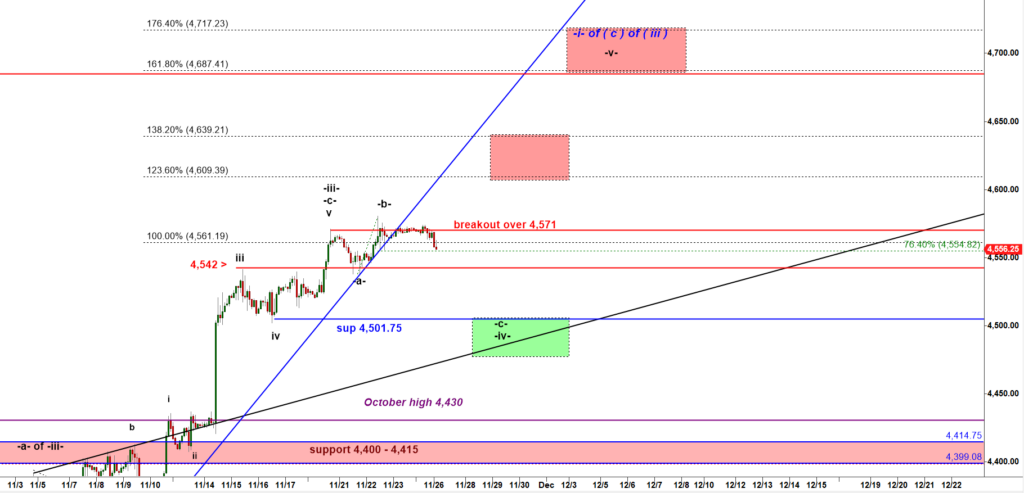
As long as bears hold ES under 4,565 they will remain in control. However, I would keep an eye on 4,571 resistance. If bulls manage to push ES over that level it can be considered a long breakout setup.

One important thing you need to understand about application of the Elliott Wave theory to unfolding rallies like that.

On a micro scale, we can attempt counting the November rally as an unfinished five wave up move. However, an unfinished five wave up structure like we do have at the moment is in fact a three wave up structure. A three wave up structure is a structure of a corrective wave.

If we get a three wave up corrective structure making a lower high that means the next leg down woudl make lower lows. So either we get a wave -iv- down followed by a wave -v- up to a higher high to complete the five wave up structure and we will confirm the bullish outlook.

Or, bears step in here, push ES under 4,400 and leave bulls with only a corrective three wave up bounce meaning that a break under 4,400 would confirm start of a large potentially impulsive move down that would make a lower low under 4,100.

The support 1 = 4,500.

The critical support 2 = 4,400.

Bonus 1.

I regularly use projection tool that I coded based on findings of W.D.Gann.

ES-mini 240 min chart

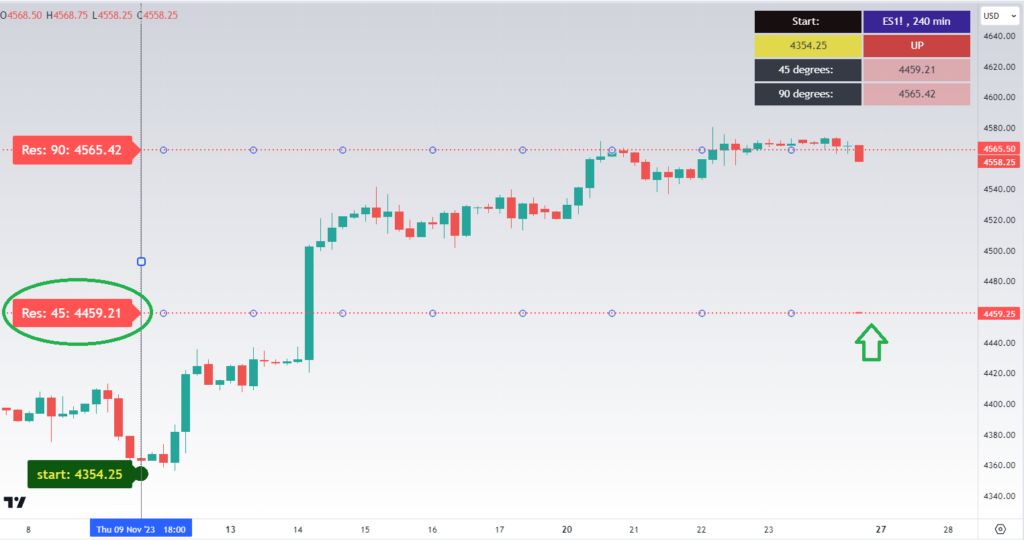
W.D.Gann was a legendary trader who created formulas that allow you to correctly predict important support and resistance levels for months ahead. You can read my explanation with numerous examples here and here.

Note that the rally stopped right at the Gann’s level of resistance, a 90 degrees up off the low made by re previous pullback.

If bulls lose 4,565 bears will be able to push it down to 4,459, the lower Gann’s level, a 45 degrees up off the low = 4,459.25.

BONUS 2.

There is a theory that Crude oil leads SPX by approximately 45 trading days.

This chart shows the blue line, the crude oil price shifted by 45 days:

ES-mini Daily chart vs Crude Oil shifted by 45 trading days

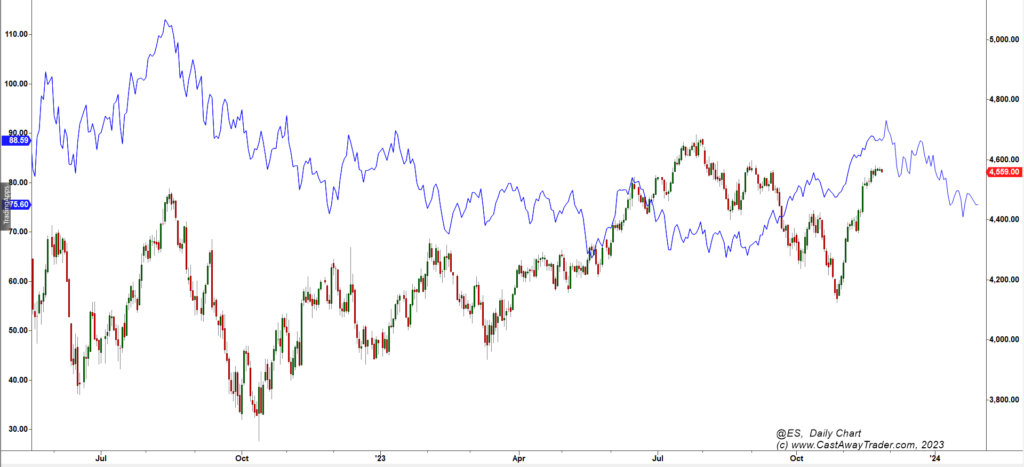
Crude perfectly predicted the top on SPX in May and Aug 2022.

As you can see, this chart showing price of crude displaced by 45 days argues for S&P to turn down and start following crude.

Subscribe to Free Updates

Get Unlimited Access

PrevPrevious$ES: Two Path Leading Higher
Next$ES: The November Rally Could Complete the Right Shoulder of the Head and Shoulders Reversal PatternNext

More To Explore

$SPX: Potential Reversal Point: Watch 6,222 – the Perfect Fib Confluence

$SPX #topping #ElliottWave #trading setup SPX is approaching a perfect confluence of two fibs at 6,222. SPX has made enough

CastAwayTrader July 2, 2025

$BTC: Attractive Breakout Setup in Bitcoin

$BTC $BTCUSD #Bitcoin I am watching an attractive long setup forming before our eyes: BTCUSD 120 min chart I expect

CastAwayTrader July 1, 2025

Important Disclaimer

CastAway Trader LLC, the publisher of this web-site and videos is not registered as an investment adviser nor a broker/dealer with either the U. S. Securities & Exchange Commission or any state securities regulatory authority. Users of the website www.castawaytrader.com and viewers of the videos are advised that all information presented on the website is solely for informational purposes, is not intended to be used as a personalized investment recommendation, and is not attuned to any specific portfolio or to any user’s particular investment needs or objectives.

Trading stocks, options, or futures carries a high level of risk, and may not be suitable for all investors. Before deciding to trade, you should carefully consider your objectives, financial situation, needs and level of experience. CastAway Trader LLC provides general overview of trading methods that does not take into account your objectives, financial situation or needs. The content of this website must not be construed as personal advice. All trading setups and/or trades presented in the web site and/or trading chat room by CastAway Trader an/or by other members of the chat should be considered hypothetical for educational purposes only and should not be expected to be replicated in a live trading account.

An investor could potentially lose all or more than the initial investment. You should not speculate with capital that you cannot afford to lose. Only risk capital should be used for trading and only those with sufficient risk capital should consider trading. Risk capital is money that can be lost without jeopardizing ones’ financial security or life style.

You should be aware of all the risks associated with trading. You should seek advice from an independent financial advisor.

Any information posted on this web site is not to be construed as an offer to sell or the solicitation of an offer to buy, nor is it to be construed as a recommendation to buy, hold or sell (short or otherwise) any security. All users of the website must determine for themselves what specific investments to make or not make and are urged to consult with their own independent financial advisors with respect to any investment decision. The reader bears responsibility for his/her own investment research and decisions, should seek the advice of a qualified securities professional before making any investment, and investigate and fully understand any and all risks before investing. All opinions, analyses and information posted on the website are based on sources believed to be reliable and written in good faith, but should be independently verified, and no representation or warranty of any kind, express or implied, is made, including but not limited to any representation or warranty concerning accuracy, completeness, correctness, timeliness or appropriateness. In addition, CastAwayTrader LLC and its officers and employees undertake no responsibility to notify such opinions, analyses or information or to keep such opinions, analyses or information current. Also be aware that the owners, officers and employees of the web site www.castawaytrader.com may have long or short positions in securities that may be discussed on the website, Premium Trading Chat room and/or in the videos posted by CastAway Trader LLC.

Past results are not indicative of future profits.

Subscribe to Free Updates

Get Unlimited Access