Introduction: How Head and Shoulders Pattern is Aligned with Topping Wave Count
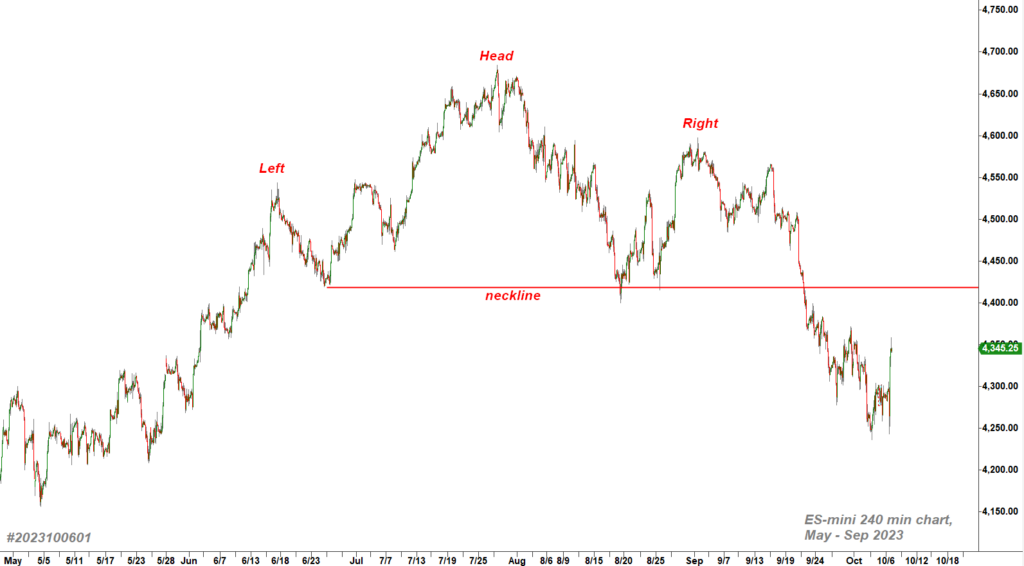
Trading is often referred to as a self-fulfilling prophecy because it revolves around recognizing familiar patterns in stock price charts. One such pattern is the “head and shoulders” reversal pattern, where prices form three peaks, with the middle one being the highest before a downward turn. This pattern’s significance doesn’t stem from some mystical force but from the fact that millions of traders have learned to react to it in a specific manner. They’ve observed that this pattern is often followed by a downward movement.
Let’s first label those waves:
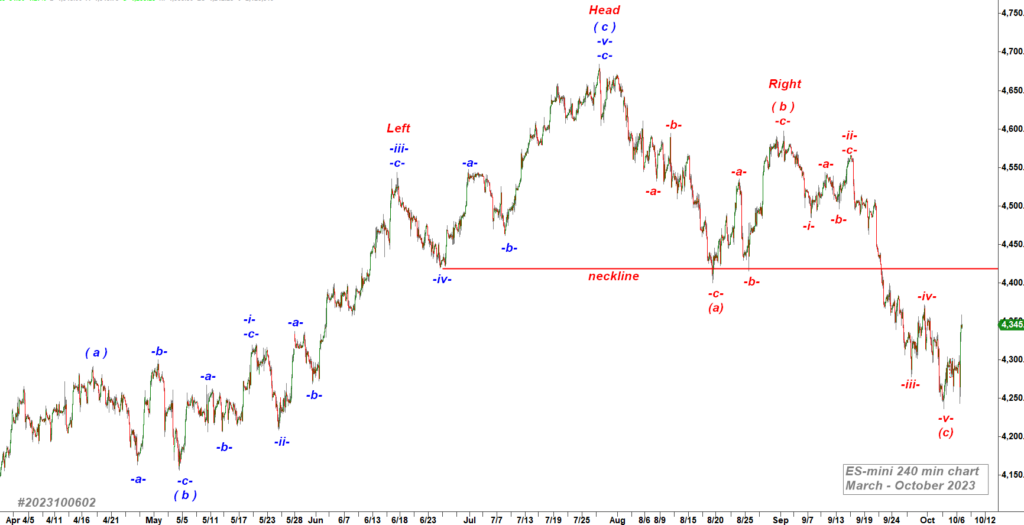
From this chart we can make several takeaways:
(1) The wave -iii- up always forms the Left Shoulder of the bearish Head and Shoulders pattern, and
(2) The wave -v- up always forms the Head of the bearish Head and Shoulders pattern, and
( 3 ) The wave -b- up always forms the final Right Shoulder of the bearish Head and Shoulders pattern.
New Video Course!