S&P 500 – Two Multi-Year Paths Leading to 5,700

  • CastAwayTrader
  • July 17, 2023
<<< Back to All Updates
<<< Macro Updates

$SPX #macro #weekly #weekend

This macro update will be discussing very long term scenarios. In particular , the main subject of this update will be to discuss if bulls have any chance to break over the Jan 2022 top.

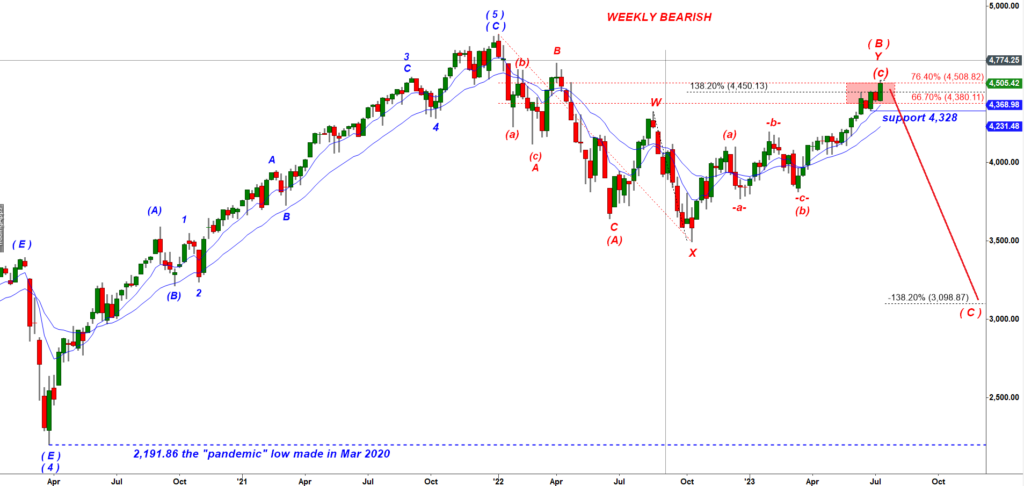
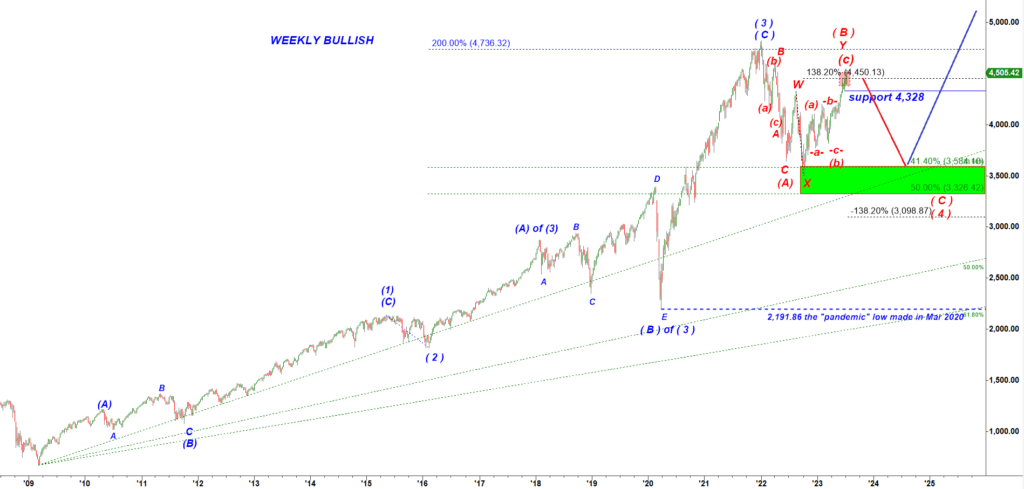
Before I start talking about a bullish alternative counts let me show you a weekly chart of S&P 500 cash index with a bearish scenario:

SPX Weekly chart, Bearish scenario

The main starting point for any macro wave count is the pandemic low made in March 2021. That low can be considered as the bottom of a corrective wave ( 4 ) down, a consolidation that was shaped as a very tricky Expanding Triangle pattern (see (A) down, (B) up, (C) down, (E) up, (D) down structure on the chart below:

SPX Weekly chart

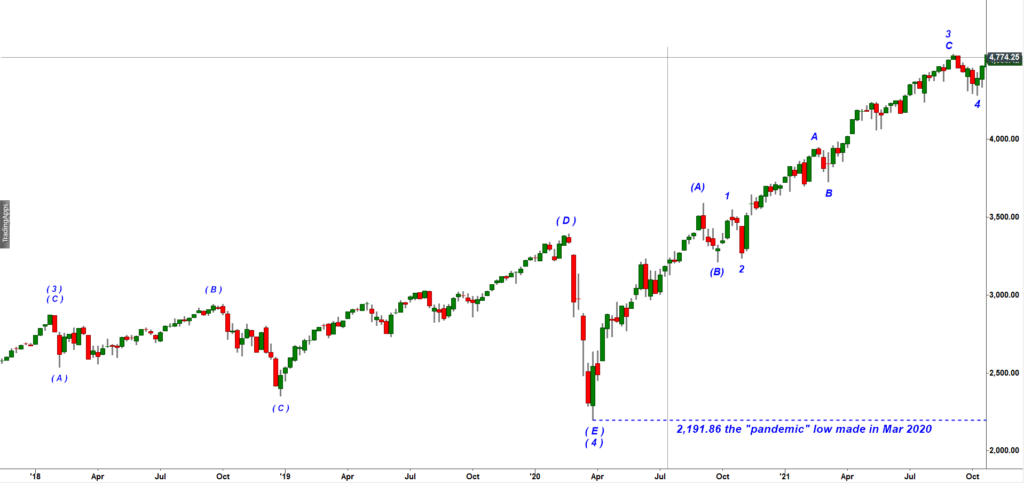
If the March 2021 low was the bottom of the wave ( 4 ) down then we need to count an (A) up, (B) down, (C) up structure off that low for the final wave ( 5 ) up.

S&P 500 weekly chart

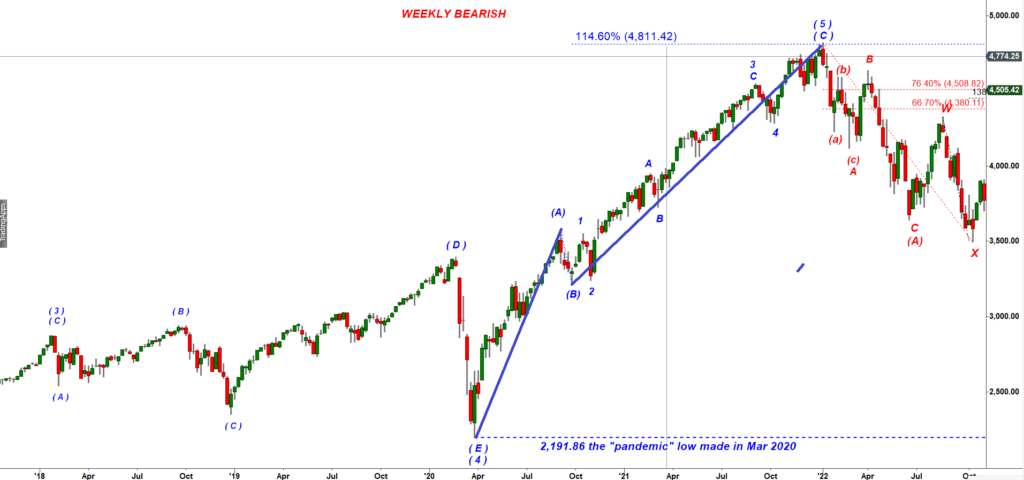
We can identify two legs up interconnected by a small pullback. We can count that move up off the low made in Mar 2021 into the top made in Jan 2022 as the final wave ( 5 ) up. Note that the subwave (C) of wave ( 5 ) up stretched to a 114.6% ext of the subwave ( A) of wave ( 5 ) up.

If bears manage to stop this rally off the Oct’22 low right here two different tools point to the target the next leg down at 3,100 (SPX cash index):

S&P 500, weekly chart

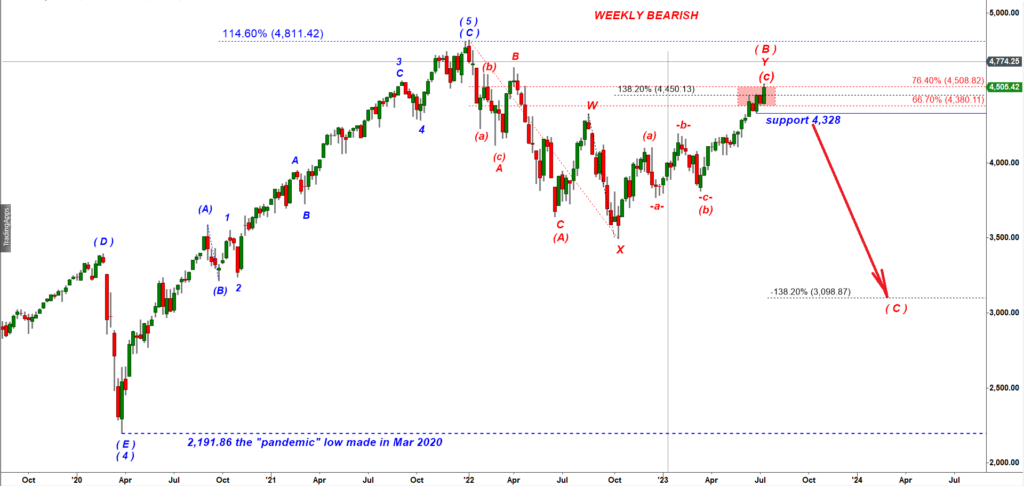
First, a negative 138.2% ext of the rally off the Oct’22 low points to 3,098.

Second, if we measure the rally off the pandemic low made in March 2021 to the top made in Jan 2022 and apply the strongest 66.7% retracement we will get 3,070. That is a very tight confluence of fibs.

PART II. Looking for a path leading to new highs.

That long term bullish wave count actually makes a lot of sense to me:

S&P 500 Weekly Chart

Note how shallow that wave ( 2 ) down looked like. The alternation guidance suggest that wave ( 4 ) down may be quite complex and take a lot of time.

below I will describe two alternative bullish counts that pave the road up to 5,700:

S&P 500 Weekly Chart

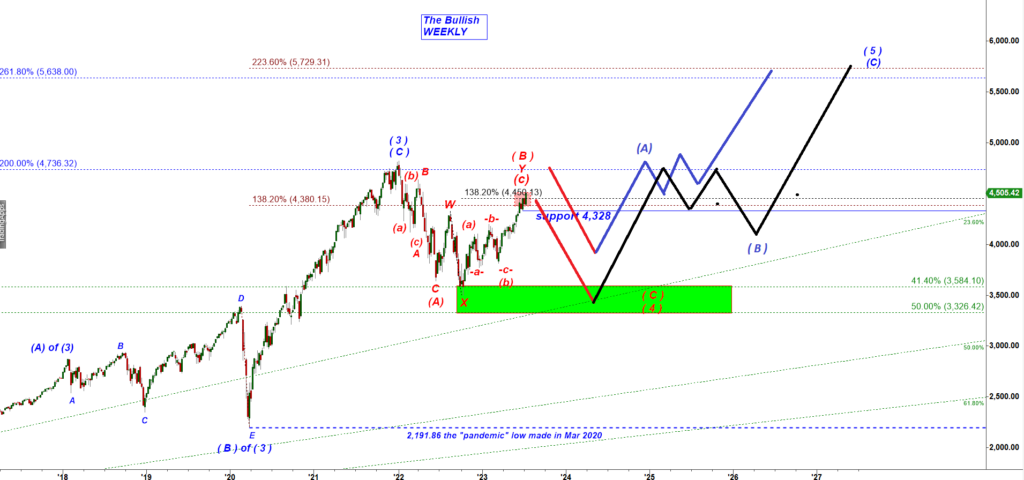
As you can see, even under the bullish counts I can not consider the decline into Oct’22 as a completed (A)-(B)-(C) down structure of a large wave ( 4 ) down. That makes me expect another leg down before the real sustained breakout over the Jan’2022 top can happen.

The most reasonable count is to consider the decline into the Oct’22 low as the first leg down, a subwave (A) of wave ( 4 ) down. Then we can infer that this move up should be a corrective wave ( B ) up.

The problems with (B) up that they are wild and hardly predictable.

Very often they keep extending higher to a higher high over the top of the wave ( 3 ) up turning a corrective structure into the Running Flat or Expanding Flat structure. That subwave (B) up can top right here. Then bears should be able to push SPX all the way down back to the Oct’22 low in a subwave (C) of wave ( 4 ) down. But because bulls managed to push S&P over the 66.7% retracement of the 2022 decline, a super important resistance for any pullback, I can not exclude a scenario where that rally would keep pushing higher to a nominally higher high over the Jan’22 top. In that case, this rally could extend to 5,000 SPX in a subwave (B) up of wave ( 4 ) down, followed by a 1,000 point drop to 4,000 in a subwave (C) of wave ( 4 ) down.

At this point of time I would assign not more than 25% probability to that “a new higher high” Running Flat scenario and 75.5% probability for the scenario where S&P would turn down without making a new higher high.

Let’s get back to the micro level:

ES-mini 240 min chart

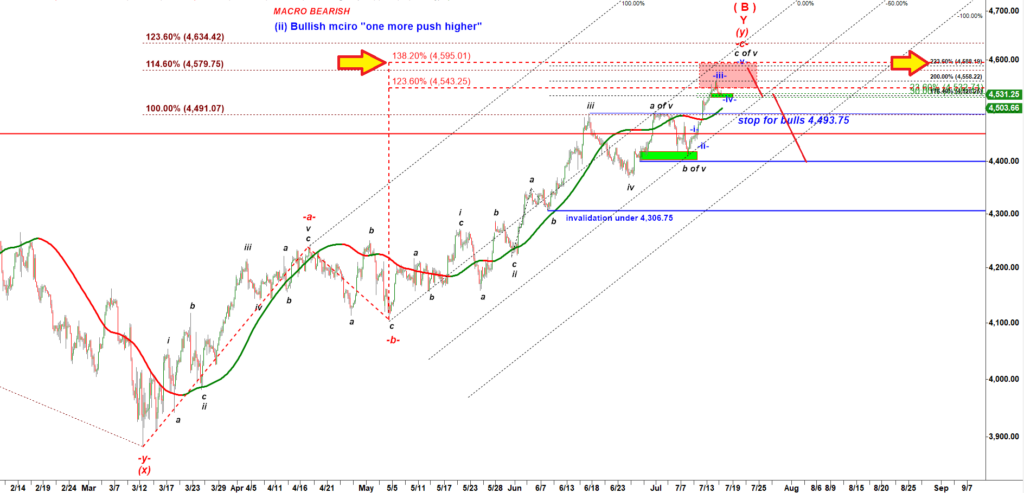
Under the weekly MACRO BEARISH scenario and one of weekly Macro Bullish scenarios ES/SPX is about to top in a large corrective wave (B) up. The bullish micro allows bulls to make one more push higher to 4,580 – 4,600 before that wave ( B ) up tops out and bears start a new leg down in a large wave ( C ) down.

Subscribe to Free Updates

Get Unlimited Access

PrevPrevious$ES: Hit the Target 1. Can It Stretch Higher to the Target 2?
NextES: Keeps Climbing Towards the Target 2 = 4,595Next

More To Explore

$ES: Leaking Down to a 80 Day Trough As Expected

$ES #ES-mini #Elliott Wave Today the US stock market is closed. Let’s review the overnight decline in ES-mini futures. ES

CastAwayTrader June 19, 2025

$ES: This Consolidation Builds a Base for Another Rally

$ES #ES-mini #triangle ES continues to consolidate in a narrow range squeezed in between of two contracting trend lines: ES-mini

CastAwayTrader June 18, 2025

Important Disclaimer

CastAway Trader LLC, the publisher of this web-site and videos is not registered as an investment adviser nor a broker/dealer with either the U. S. Securities & Exchange Commission or any state securities regulatory authority. Users of the website www.castawaytrader.com and viewers of the videos are advised that all information presented on the website is solely for informational purposes, is not intended to be used as a personalized investment recommendation, and is not attuned to any specific portfolio or to any user’s particular investment needs or objectives.

Trading stocks, options, or futures carries a high level of risk, and may not be suitable for all investors. Before deciding to trade, you should carefully consider your objectives, financial situation, needs and level of experience. CastAway Trader LLC provides general overview of trading methods that does not take into account your objectives, financial situation or needs. The content of this website must not be construed as personal advice. All trading setups and/or trades presented in the web site and/or trading chat room by CastAway Trader an/or by other members of the chat should be considered hypothetical for educational purposes only and should not be expected to be replicated in a live trading account.

An investor could potentially lose all or more than the initial investment. You should not speculate with capital that you cannot afford to lose. Only risk capital should be used for trading and only those with sufficient risk capital should consider trading. Risk capital is money that can be lost without jeopardizing ones’ financial security or life style.

You should be aware of all the risks associated with trading. You should seek advice from an independent financial advisor.

Any information posted on this web site is not to be construed as an offer to sell or the solicitation of an offer to buy, nor is it to be construed as a recommendation to buy, hold or sell (short or otherwise) any security. All users of the website must determine for themselves what specific investments to make or not make and are urged to consult with their own independent financial advisors with respect to any investment decision. The reader bears responsibility for his/her own investment research and decisions, should seek the advice of a qualified securities professional before making any investment, and investigate and fully understand any and all risks before investing. All opinions, analyses and information posted on the website are based on sources believed to be reliable and written in good faith, but should be independently verified, and no representation or warranty of any kind, express or implied, is made, including but not limited to any representation or warranty concerning accuracy, completeness, correctness, timeliness or appropriateness. In addition, CastAwayTrader LLC and its officers and employees undertake no responsibility to notify such opinions, analyses or information or to keep such opinions, analyses or information current. Also be aware that the owners, officers and employees of the web site www.castawaytrader.com may have long or short positions in securities that may be discussed on the website, Premium Trading Chat room and/or in the videos posted by CastAway Trader LLC.

Past results are not indicative of future profits.

Subscribe to Free Updates

Get Unlimited Access