#Bitcoin $BTCUSD #Macro #longsetup
Very Bullish Wave Count: This drop may complete the wave 4 shaped as a very bullish Running Flat structure.
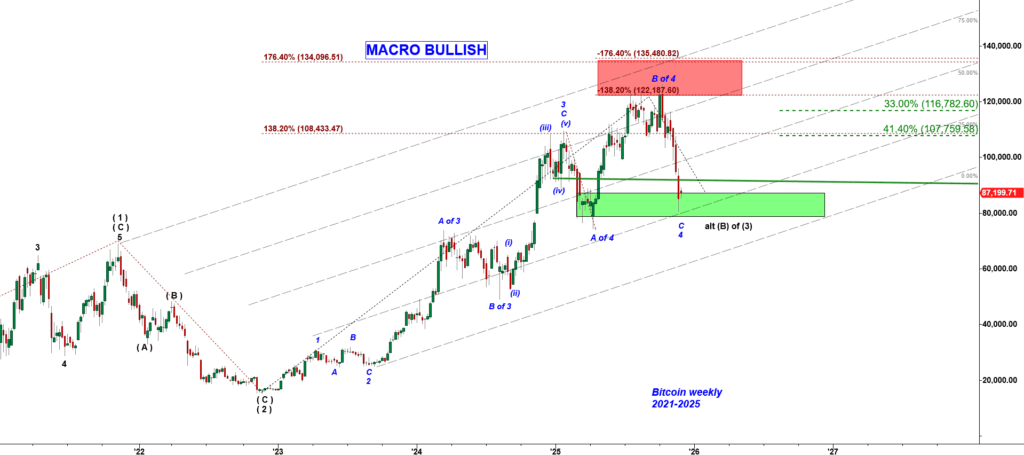
BTCUSD Weekly chart
There is a viable interpretation of the current structure that treats the sharp decline as subwave C of a larger Wave 4 correction. Two key technical arguments support this view:
- The April 2025 decline did not form a full A-B-C structure.
This suggests that the drop was only the first leg of a larger corrective pattern, not a completed correction. - The rally that peaked in October 2025 failed to reach typical Wave 5 upside targets.
In other words, the bulls attempted to start a new impulsive leg without building the proper base. Without a full three-wave pullback behind it, that advance lacked structural support and stalled prematurely.
If we classify the April 2025 drop as only wave A, then the October 2025 peak becomes wave B, and the current decline becomes wave C of a Running Flat correction for Wave 4.
Running Flats are extremely bullish formations. They occur when market strength is so significant that wave B exceeds the prior high before wave C completes the correction.
In this interpretation:
- The current decline completes the A-B-C corrective base required before a sustained Wave 5 advance.
- Wave 4 would now be structurally complete.
- Wave 5 has the room — and the macro strength — to extend significantly.
Under this count, Wave 5 has upside potential into the 146,000 – 158,000 range.