$ES #ES-mini
Es-mini 5 min chart
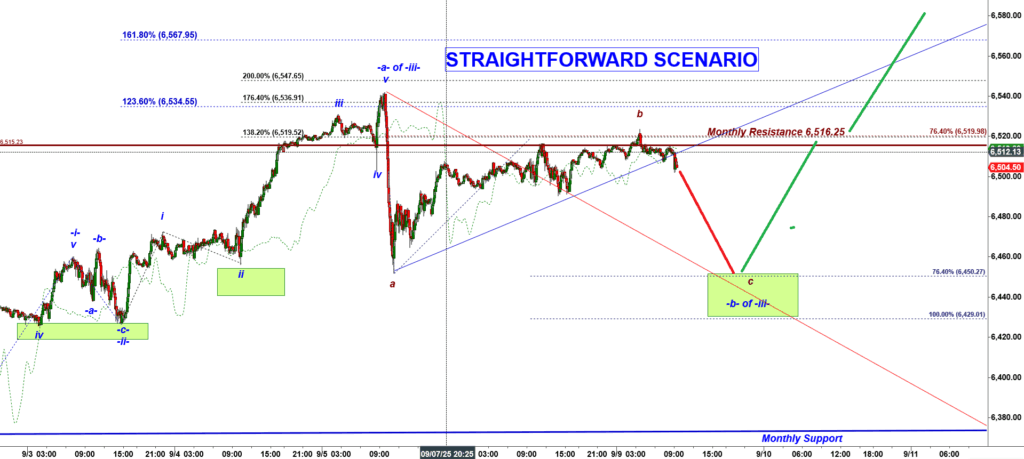
Note the repeating pattern: a sharp drop in a subwave a down, followed by a slow, grinding recovery move up. That recovery often takes two, three, or even four times longer just to return to the starting point of the drop.
This type of sluggish advance is a strong indication we’re dealing with a corrective wave b up.
Right now, that slow grind has run directly into the wall of Monthly Resistance. A pullback from this level, followed by a sudden bullish reversal and a clean breakout above 6,516.25 (the Monthly Resistance), would set up a high-conviction long trade.
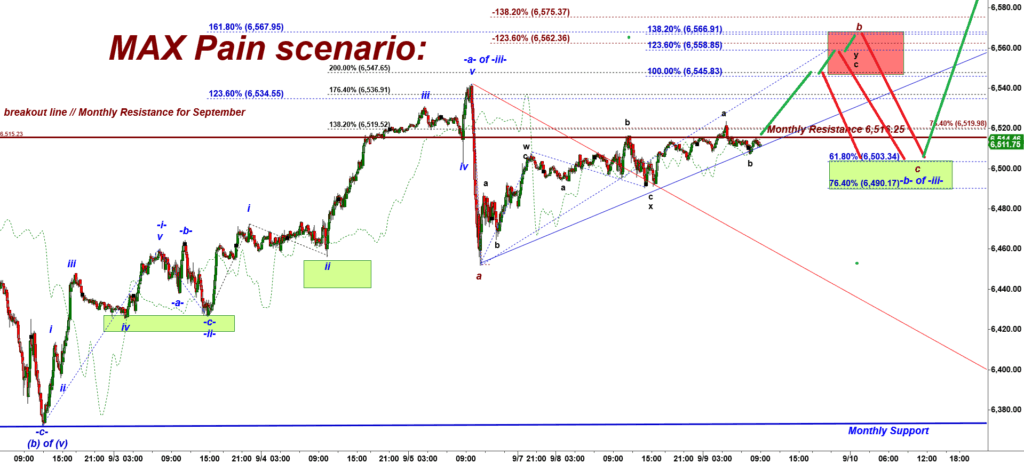
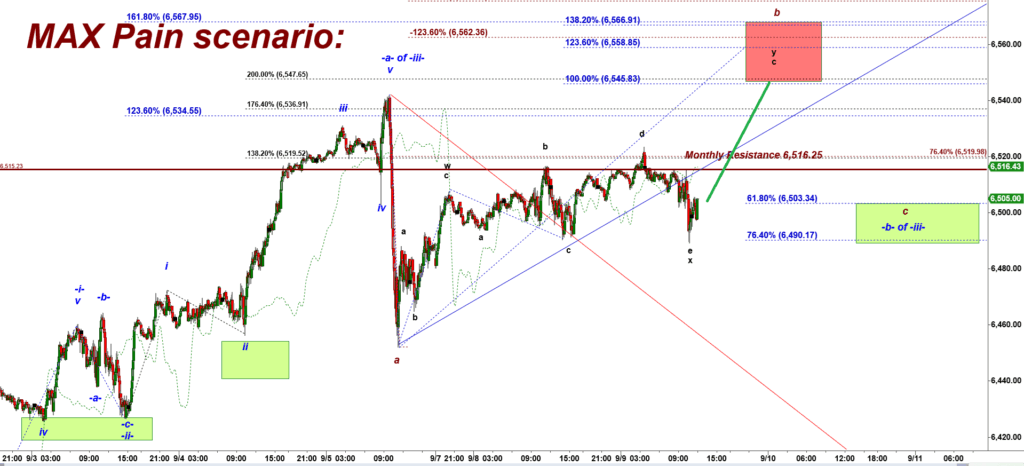
The MAX Pain Scenario
I can also see a MAX Pain scenario unfolding. In this case, the sluggish move up could extend even higher from here:
ES-mini 15 min chart
If bears fail to break the support of the blue trend line currently holding ES-mini, bulls may attempt a premature breakout above 6,516.25, the Monthly Resistance.
However, because ES has not built a proper base for such a move, I would still label that rally as part of the corrective wave b up. In that case, we should expect a sharp and unnerving drop back down to retest the broken Monthly Resistance — now turned support at 6,516.25 — with a likely momentary undershoot of that level to flush out long positions through forced liquidation.
Your Takeaways: Key Trading Principle
When you trade ES-mini, always remember: the best trigger for a new rally is a failed breakdown under an important level of support. And what is the strongest level of support? The previously broken important resistance.

posted at 11:57 AM EST
that looks really bullish:
ES-mini 5 min chart
Check, ES has just completed a tricky Expanding Triangle a-b-c-d-e structure.
And note that it tested the support of the Daily pivot (the thick black line) but bulls defended it:
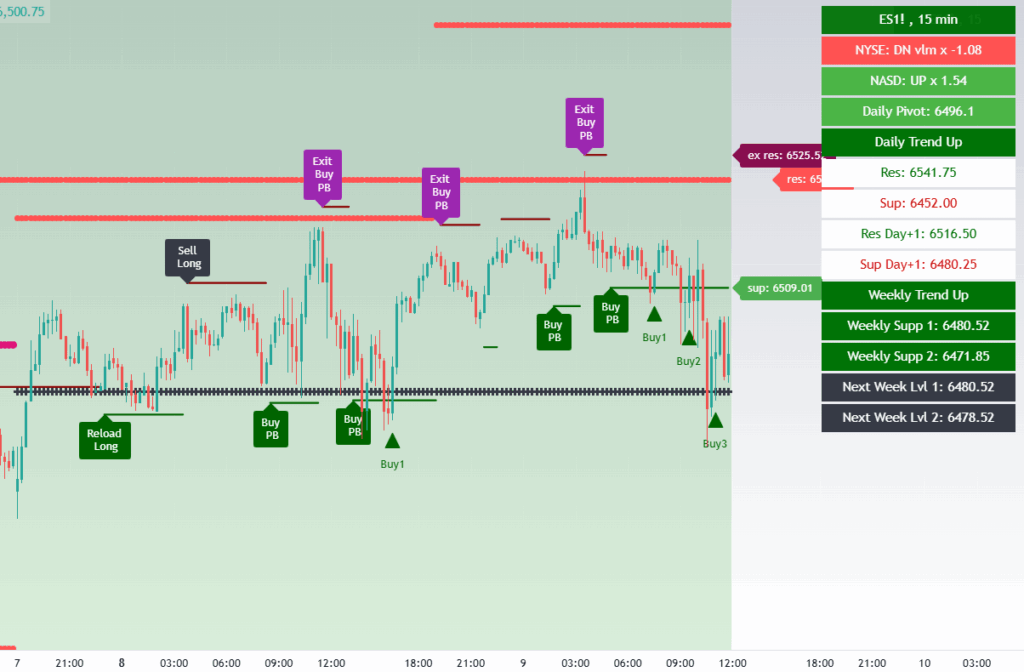
Here bulls have a setup to produce a rally into the Red Target box.