$ES #ES-mini #acceleratonrally
Overnight, we saw a micro wave iii up top out, followed by a micro wave iv pullback. That dip didn’t last long—bulls quickly stepped in, launching a micro wave v of -c- of -iii– to the upside. So far, ES continues to perfectly follow our bullish playbook.
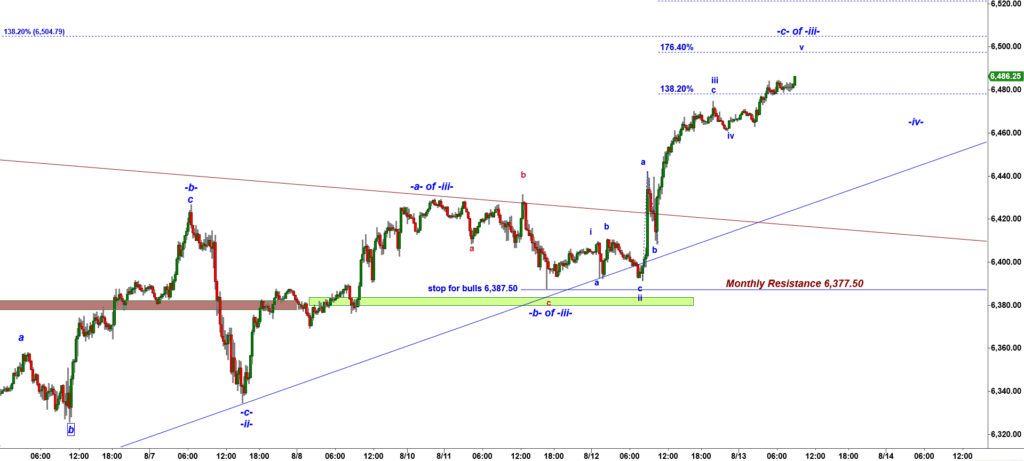
ES-mini 15 min chart
Zooming Out – The “Less Bullish” Scenario
On the 120-minute chart, we can see why I call this the less bullish scenario—it doesn’t expect much more from the bulls. This setup assumes we may be in a shortened, compressed five-wave up structure, where the strongest part of the rally (wave -iii- up) tops out around 138.2% of wave -i- up.
In a normal five-wave advance, wave -iii- typically extends to 176.4% or even 223.6% of wave -i-. The compressed version means the bulls might run out of steam sooner.
Key watch zone: the yellow box at 6,504 – 6,513. How the bears respond here will be critical.
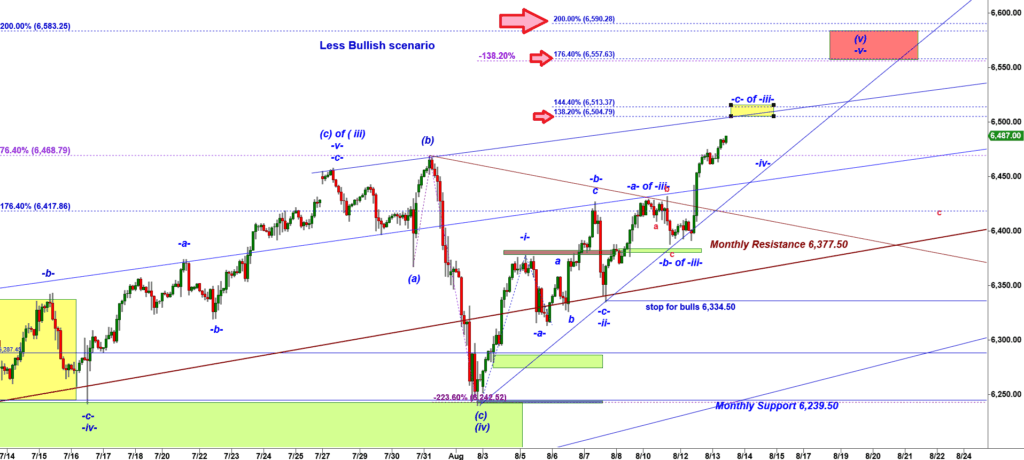
ES-mini 15 min chart
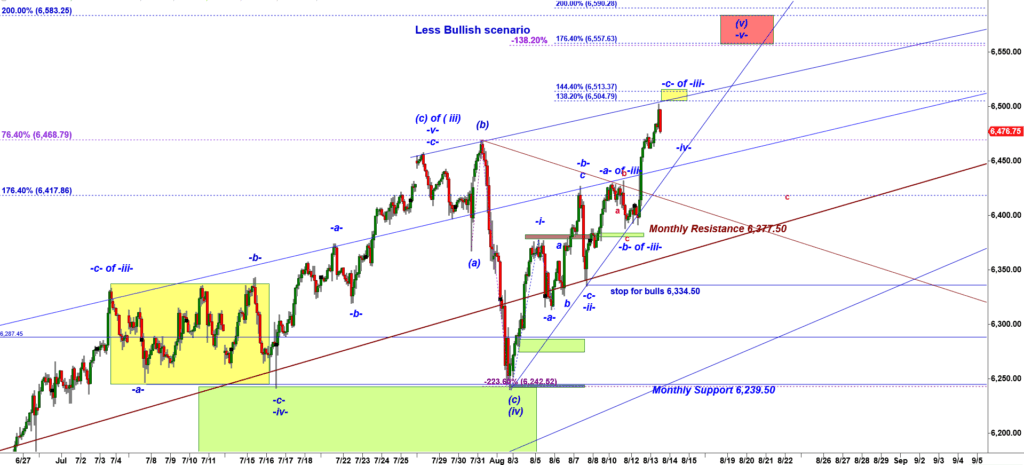
Levels in Focus
Yesterday morning, I pointed out Target 1 = 6,500 for the rally. We’re now right in that neighborhood.
- 6,475.50 – Secondary Daily Resistance.
- We start today above that level, which confirms we are in wave -iii- up. Yes, you could argue the market is overbought—but you could also say bullish momentum is exceptionally strong and bulls have firm control.
When price trades above a secondary resistance, you need to shift your focus to the next day’s projected levels. For tomorrow, the 6,470 level will be key—bulls will need to defend it to keep price action in “runaway mode.”
Trailing Support Rule
In an uptrending market, once a daily resistance is broken, it becomes trailing support. Price spends 85–90% of the time above that level. When it revisits it, it’s usually to test the “buy the dip” resolve of bulls—most see it as another long entry opportunity.
Bottom line: The bullish structure is intact, momentum is strong, and the key battleground for the day is 6,500–6,513. Above it, the bulls keep pressing; a failure there could confirm the “less bullish” compressed structure. This afternoon and tomorrow, all eyes on 6,470 as the make-or-break trailing support.

published at 11:06 AM
We are getting a nice bearish rejection off the yellow box we discussed pre-market:
ES-mini 120 min chart
Let’s go micro to a 15 min chart:
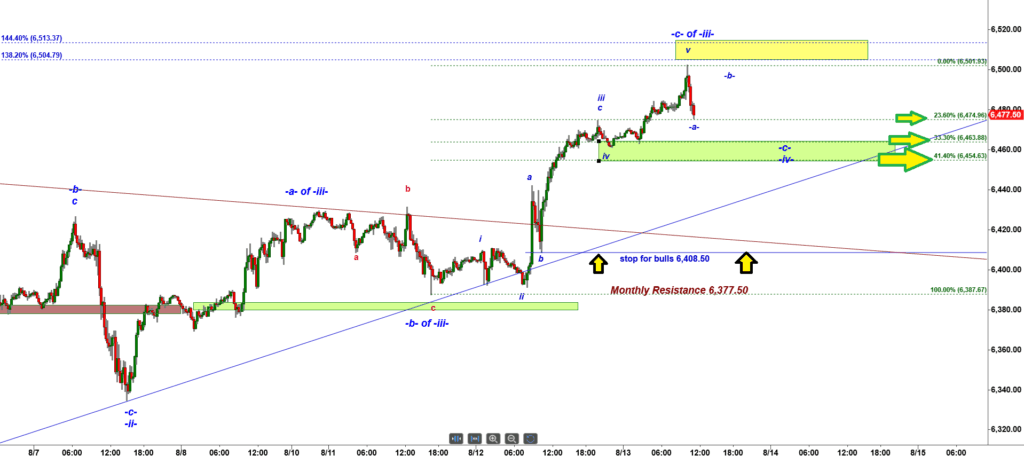
ES-mini 15 min chart
We just saw a drop to the 23.6% retracement of the preceding five-wave up structure—specifically, the micro rally in subwave -c- of wave -iii- up.
We always measure retracements against the most recently completed five-wave up structure, because traders have short memories—they focus on the freshest move, not older ones.
That’s why, for the first leg down (subwave -a-) in the anticipated -a- down, -b- up, -c- down corrective pattern of wave -iv- down, we calculate retracements from subwave -c- of wave -iii- up, not from the entire wave -iii- up.
- First support: 23.6% retracement at 6,475
- Second support: 33.3% retracement at 6,464.
In the most bullish scenario, subwave -a- down bottoms right at that first support (6,475). From there, we would expect a strong bounce in subwave -b- up, potentially re-testing the wave -iii- up high or even overshooting it—consistent with a Running Flat or Expanding Triangle structure.