#MonthOpeningRange $SPX $ES
We have formed the Month Opening Range:
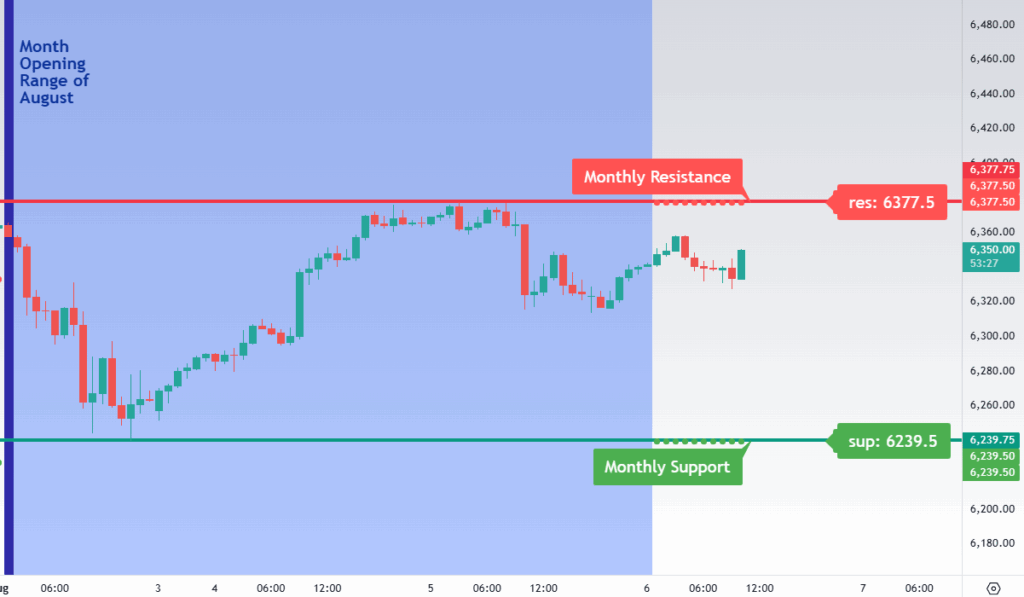
To start a trending move up bulls need to break over the Monthly Resistance 6,377.50.
To start a trending move down bears need to break under the Monthly Support 6,239.50.
This is how a bullish wave count looks like:
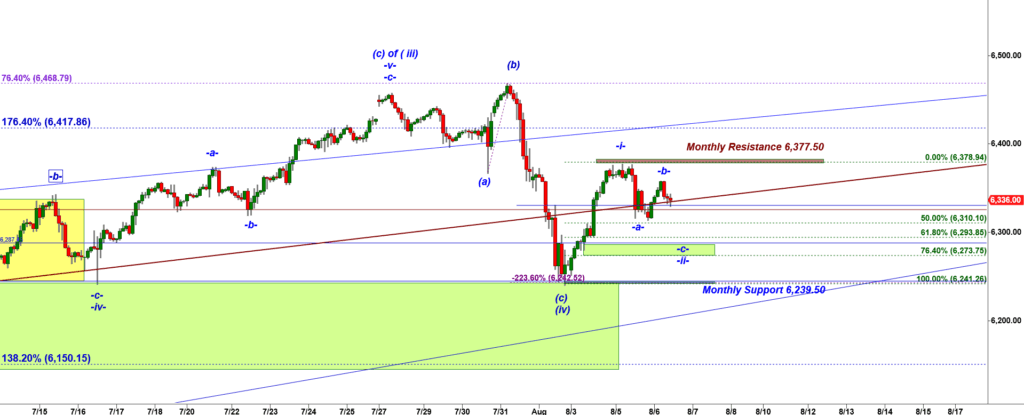
ES-mini 120 min chart
We can count the rally that topped on Monday as a micro wave -i- up.
If we get a clean a-b-c down pullback of a wave -ii- down off the Monday high of the wave -i- up that would be an attractive long setup.
Break under the Monthly Support 6,239.50 would invalidate the bullish scenario.
We have been watching the bearish wave count:
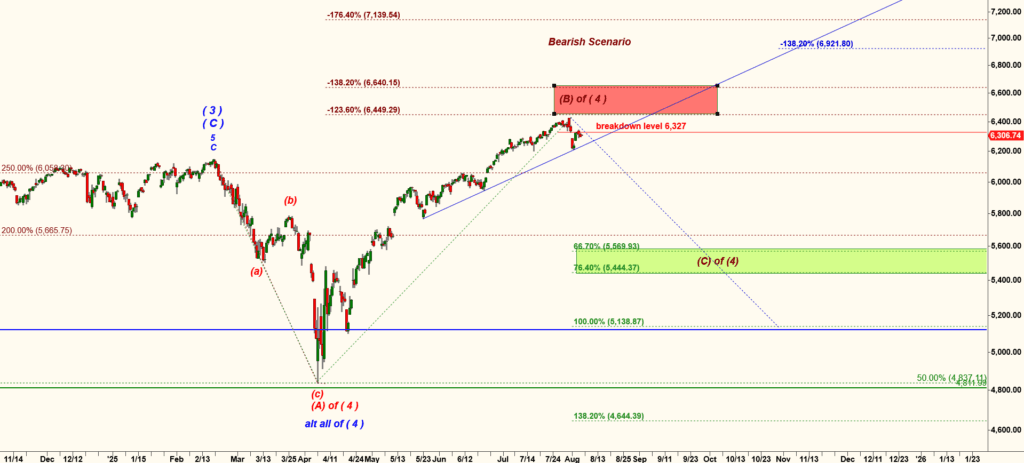
SPX 240 min chart
I will be watching that support of the blue trend line. So far bulls stopped the decline at that line.
Break under that level would confirm the bearish scenario and would most likely be followed by an accelerated decline.
There is an unfilled gap up made by a rally off the Friday low.
Very often an upper edge of the gap up works as a strong support. So price can get back down to 6,303.75 in ES-mini and 6,271.70 in SPX to tag the upper edge of the unfilled gap. That would be the first test for bulls. In the most bullish case bulls should not let bears fill the gap up.

published at 11:27 AM EST
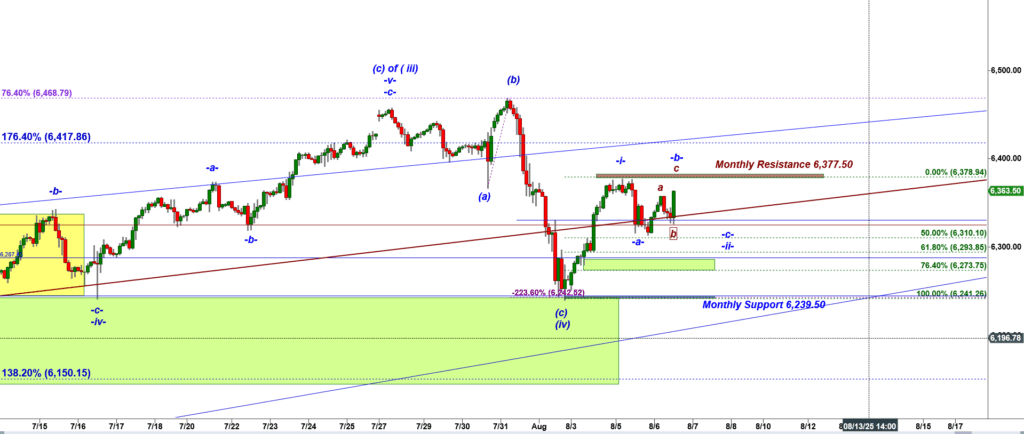
ES-min 15 min chart
That push could be a subwave c of wave -b- up to re-test the Monthly Resistance 6,377.50.
The key level to watch is the Monthly Resistance 6,377.50.
Plan A: Break over that level can trigger another leg up. That is a straightforward breakout setup.
Plan B: Bulls may overshoot the 6,377.50 level and ran out of gas. If bears push ES back under 6,337.50 they would trigger a micro “failed breakout” short setup. We still can get a short leg down in a subwave (c) of wave ( ii ) down even if bulls manage to overshoot the Monthly Resistance.