$ES #ES-mini #triangle
ES continues to consolidate in a narrow range squeezed in between of two contracting trend lines:
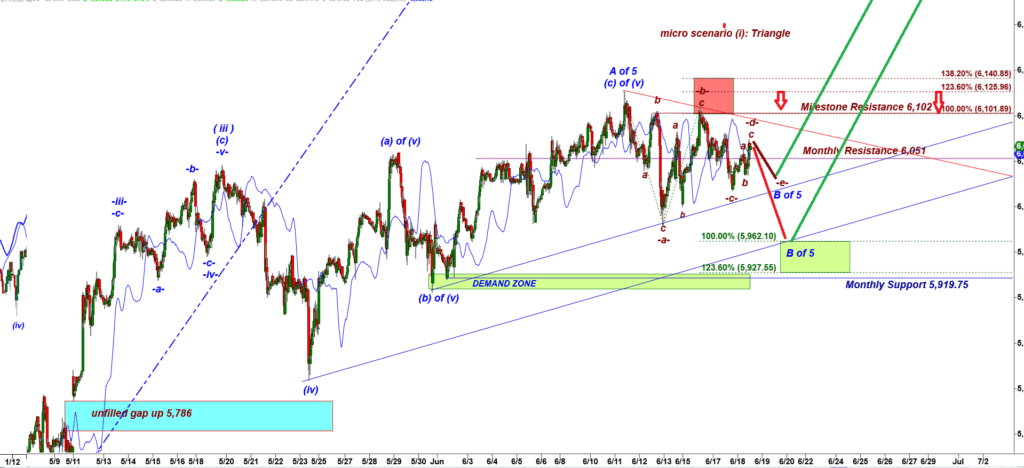
ES-mini 30 min chart
We can count that consolidation as a triangle composed of a-b-c-d-e five subwaves.
Normally, a completed triangle shaped consolidation is followed by a strong breakout driven by all the energy accumulated inside that triangle pattern.
Today the market will most likely make a big move triggered by FOMC Chairman press conference scheduled at 2-30 PM EST.
The key resistance is the milestone resistance 6,102 (Sep’25 contract).
I showed two potential paths for a breakout on the chart.
If bears push ES-mini back under the Monthly Resistance 6,051 that would become the breakout level.

The triangle wave count I shared this morning (see above) successfully predicted this move down in a subwave -e- down:
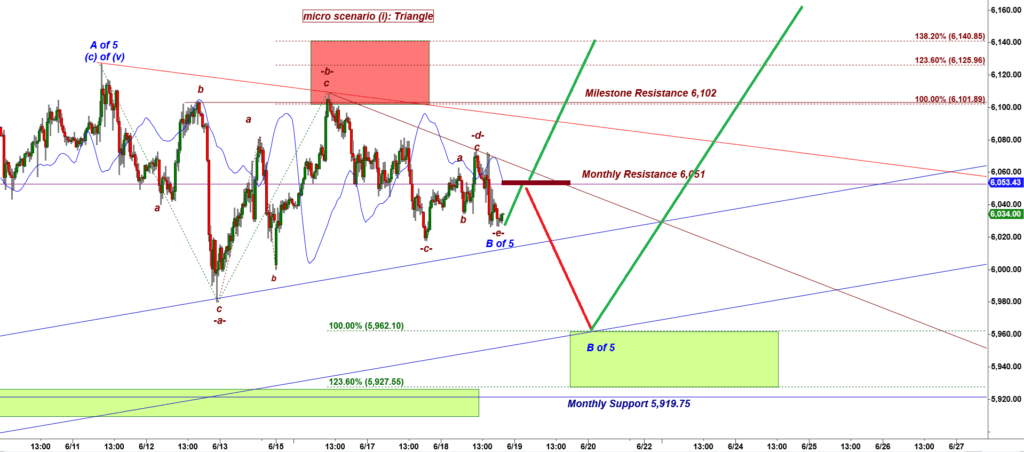
ES-mini 30 min chart
Here bulls have a setup to start another leg up. The basis for that long setup is a completed triangle shaped consolidation.
To trigger that long setup bulls need to reclaim the monthly resistance 6,051.
If bulls fail to get over 6,051 I would expect another sharp drop down to 5,962.
In that case we will consider that additional drop as overdue 80 Day cycle trough that would be another attractive long setup (a completion point of a larger -a-down,-b- up,-c- down structure).
🌀 Hurst Cycle Analysis – ES Mini
The last confirmed trough in the ES Mini occurred on 7 April 2025. This low is currently aligned with the nominal 80-day cycle, a key component of Hurst’s cyclic model.
The nominal 80-day cycle is a theoretical average used for phasing and forecasting. While it’s labeled as “80 days,” actual trough-to-trough intervals typically vary based on market dynamics. In bullish environments, it’s common for cycle troughs to occur earlier than nominal—often compressing into the 65–72 calendar day range.
📍 Cycle Timing:
- Adding 80 calendar days to 7 April points to a projected trough on 26 June 2025.
- However, adding 72 calendar days lands on 18 June 2025 — which is today.
This means we have now entered the ideal time window for the next 80-day cycle trough. Given Hurst’s principle of harmonicity and variation, it is statistically consistent for the cycle to bottom within a ±10% window of the nominal period — reinforcing that today could mark a potential 80-day trough.