$NQ #NQ-charts #Accumulation #long setup
NQ Analysis – Potential Running Flat & Accumulation Pattern in Play
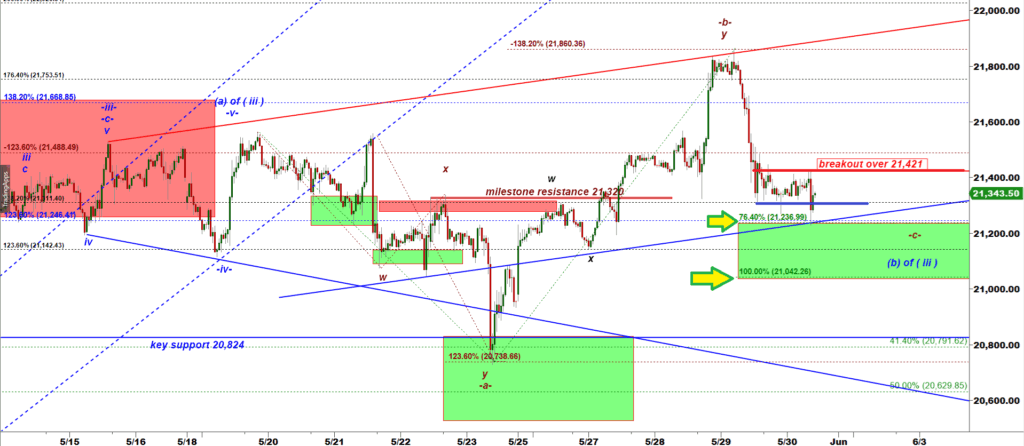
NQ has just tagged the upper boundary of the Green Box, completing a precise 76.4% extension of subwave -a- down. In other words, the second leg down (subwave -c-) is only 76.4% the size of the initial leg down (subwave -a-), while the preceding bounce in subwave -b- extended up to the -138.2% Fibonacci extension of subwave -a-.
While the structure may appear exotic at first glance, this is actually one of the most common corrective formations—known as a Running Flat.
If bulls step in here, we could see a strong rally take shape from this zone.
NQ-mini 30 min chart
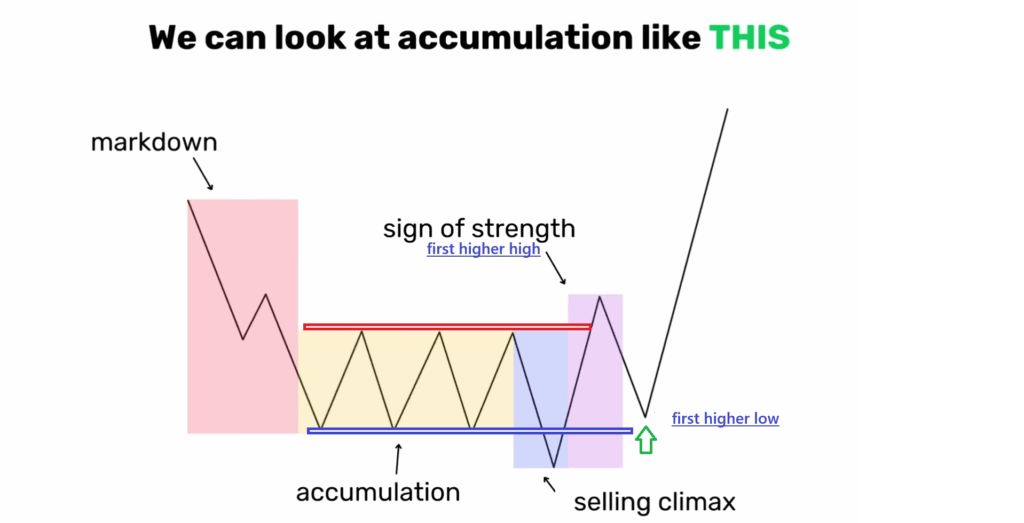
On the intraday chart, we can also spot a textbook Accumulation Pattern forming between two horizontal boundaries—marked by the blue (support) and red (resistance) lines.
This pattern typically resolves in three steps:
- A false breakdown below the lower boundary (blue line).
- A swift recovery by bulls, driving price above the blue line and then the red line (top of the range).
- A pullback to retest the red line, which may even dip back into the previous range.
✅ Conclusion: For bulls to confirm this accumulation breakout and shift sentiment, NQ must break and hold above the red resistance line at 21,421.
THE AFTERNOON UPDATE – posted at 3-01 PM EST
WE got a spike down that tagged the lower boundary of the Green Box. Then bulls immediately stepped in and turned the price up
What bulls need to do to confirm the bullish reversal is to break over the red resistance line 21,421.
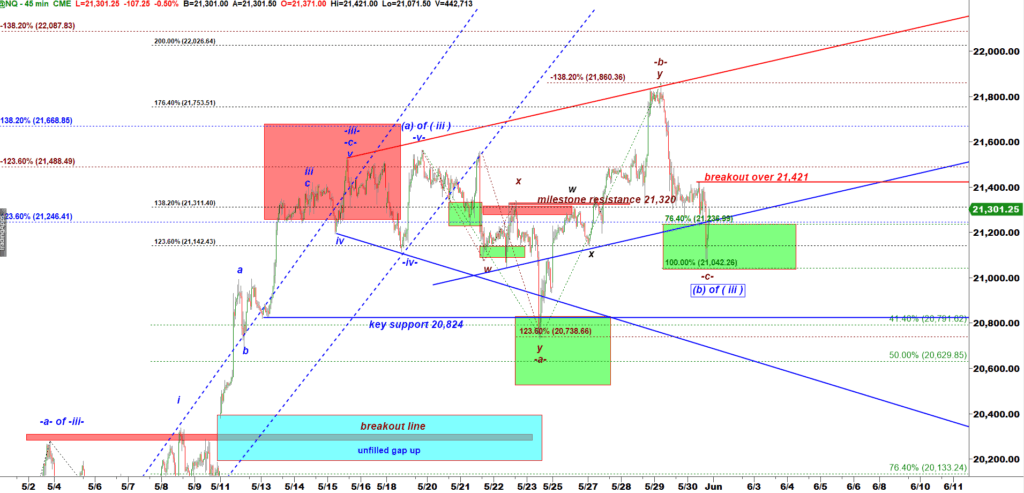
NQ-mini 45 min chart
We need bulls to make that first higher high, see the model chart:

We have been tracking a corrective pullback that builds a base for another large leg up in a subwave (c) of wave ( iii ) up targeting 25,000.