$ES #ES #Elliott Wave
ES dropped to the Macro Target 3 and enetered the green macro Demand zone. We have had that Macro Target 3 on our chart since mid December 2024
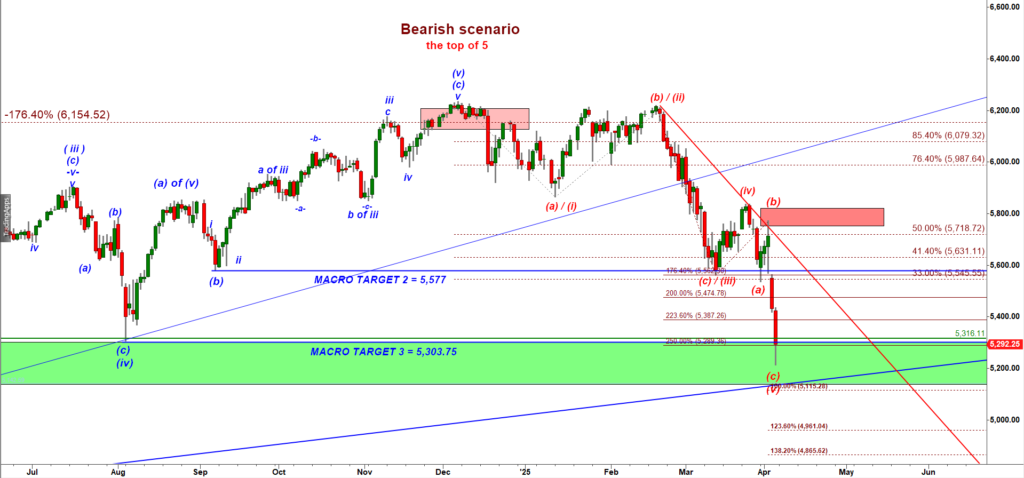
ES-mini Daily chart
5,303.75, the Aug’24 low, is the key level to watch!
Bulls have to push ES back over that level to trigger a long failed breakdown setup.
Under that primary less bearish wave count ES arrived to strong support. We may count it as the first leg down off the top as a wave A down. That count argues for a big (a) up, (b) down, (c) up bounce in a wave B up that should rally to at least 5,550 and retrace at least 50% of the whole decline.
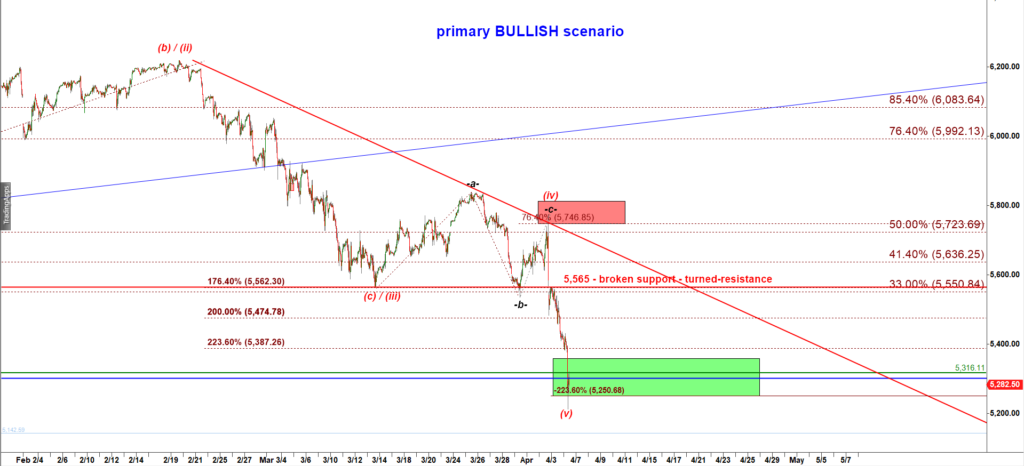
ES-mini 120 min chart
Very Bearish Macro.
Bears believe that ES is in the heart of the wave ( iii ) down, its wave -iii- of (c) of ( iii):
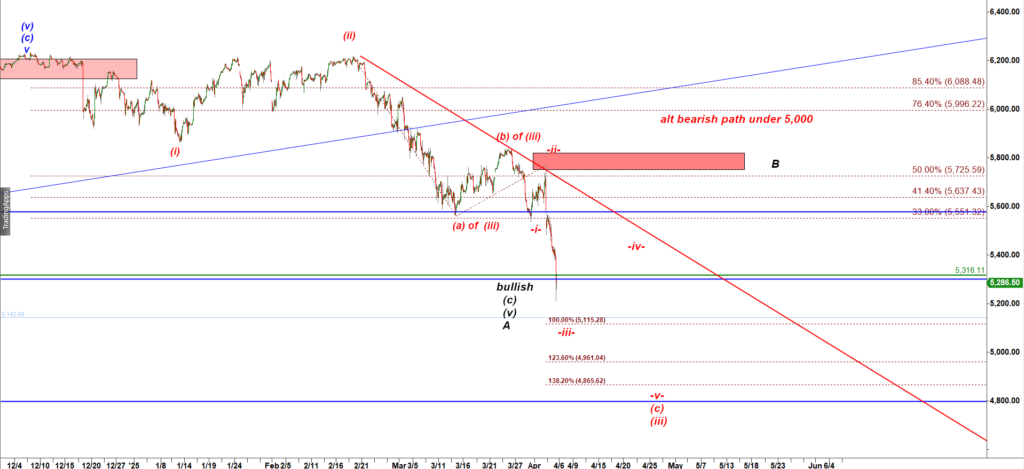
ES-mini 120 min chart
To confirm that very bearish scenario bears need to push ES lower down to 5,115 to complete -iii- of ( c ) of ( iii ) down.
THE MORNING UPDATE posted at 10:42 AM EST
Bears keep pushing and that fits the Very Bearish scenario that allows bears to push ES under 5,000.
But even under the most bearish wave count ES may pop up off the 5,184, a 100% ext:
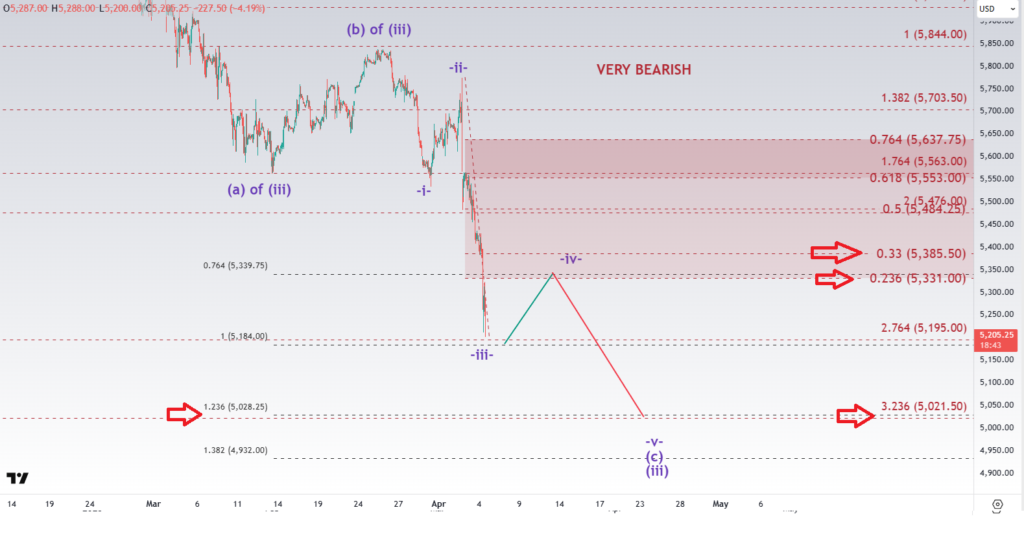
ES-mini 60 min chart