$ES #ES #Elliott Wave
This morning bulls got a gift from teh CPI data. Core and frontline inflation both are softer than expected. That data brings back expectations of a rate cut = very bullish.
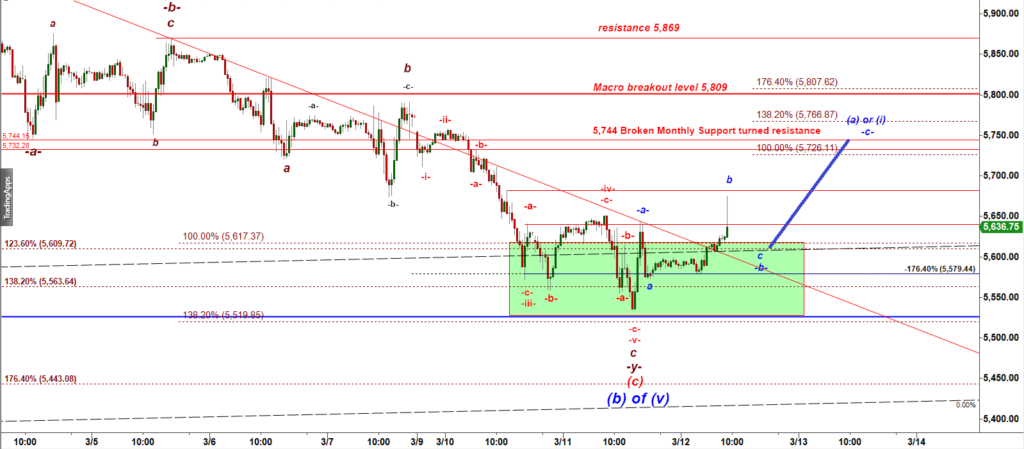
ES-mini 30 min chart
It is possible that the CPI spike was a micro subwave b up that can be followed by a shortened wave c down under the very bullish Running Flat corrective structure (wheer b up makes a new higher high and the subwave c makes a higher low than the starting point of a subwave a down):
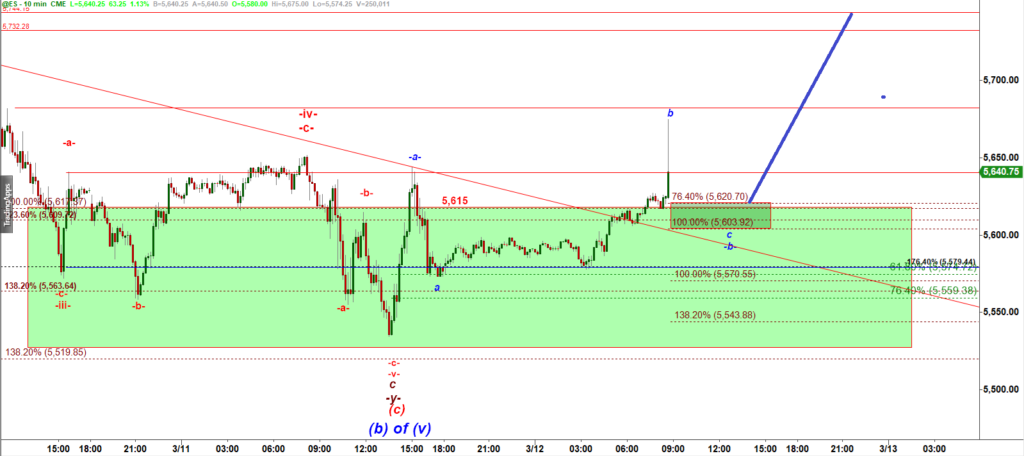
ES-mini 10 min chart
I think bulls should be able to re-test 5,744 in the next leg up
support 1 / buy point 1 = 5,621, and
support 2 / buy point 1 = 5,604.
My Plan B: go long on a breakout over 5,640.50.
MORNING UPDATE // 10;01 AM
The support 2 = 5,603 got tested:
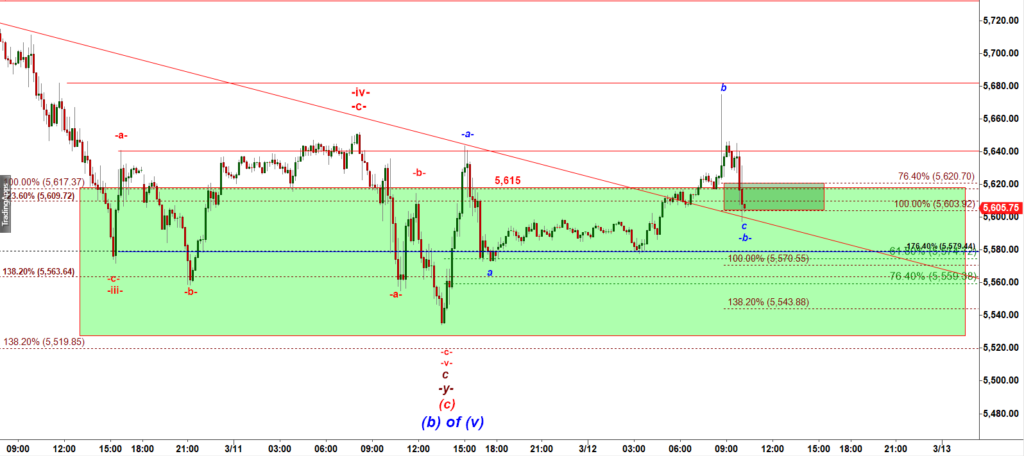
ES-mini 10 min chart
Now we got a clean -a- down, -b- up, -c- down corrective structure, a base for another leg up.