$ES #ES-mini #Elliott Wave #trading setup #bottoming
We got a corrective three wave down (a)-(b)-(c) move towards the Macro Target / Macro Support 5,476:
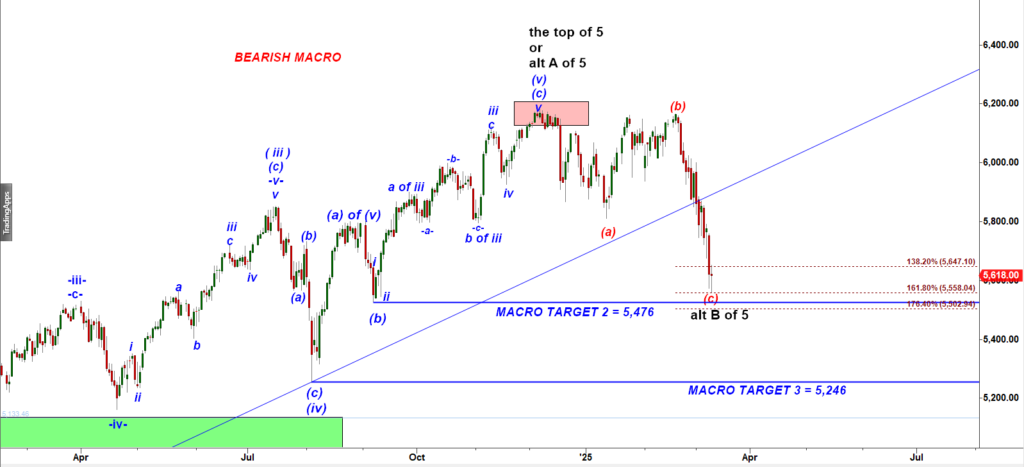
ES-mini Daily chart
That 5,476 level is a milestone support, a low made by a corrective wave (b) down in Aug 2024.
When analyzing a corrective structure, we use four key tools to identify potential reversal levels:
1. Identifying Milestone Levels
We look for previous lows within corrective waves, focusing on extremes formed by wave b, -b-, (b), or B at any degree. These levels often act as strong support areas.
2. Applying Extensions of the First Leg Down (Wave A)
The second leg down (wave C) typically finds support at either:
- 138.2% extension of wave A (5,647, which was slightly undershot), or
- 176.4% extension of wave A (5,503 in this case).
It’s important to note that markets often undershoot key support levels. The fact that ES dipped below the 138.2% extension (5,647) doesn’t necessarily mean it will continue down to the next major 176.4% extension (5,503).
3. Applying Fibonacci Retracements to the completed Five-Wave Rally
We use retracements on the rally that began in October 2022 to determine major support levels. Typically, the first strong support is found at 1 – 0.764 = 0.236 (23.6%) retracement of the rally.
- In this case, that level is 5,540.
- ES nearly reached it yesterday, making a low at 5,558.
4. Micro Counting the Waves Inside the Second Leg Down
We also attempt to break down the internal structure of the second leg down. In this case, the decline from the February 20th high can be counted as a completed corrective pattern:
- -w- down, -x- up, -y- down.
By combining these tools, we gain a clearer picture of where the market might find support and potentially reverse.
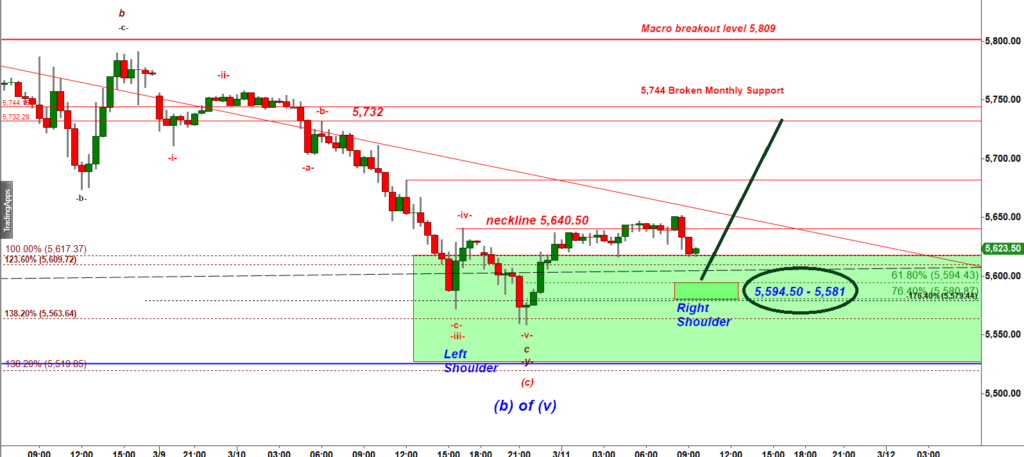
ES-mini 30 min chart
To confidently place a bet on a risky bullish reversal from a potential bottom pattern, we need broader market participation.
This means attracting inexperienced traders—those who are unaware of wave counts and key levels—to jump in.
That’s why we often look for something as visually compelling as an Inverse Head and Shoulders pattern. It acts as the perfect bait.
Here, we can identify a widely recognized bullish reversal pattern: the Inverse Head and Shoulders (IHS).
For this setup to play out:
- Support must hold at the right shoulder within the green box (5,594.50 – 5,581). This stops the bleeding.
- Bulls need to push ES above the neckline resistance at 5,640.50 to confirm the pattern, triggering a short-covering rally with a target of 5,730.
Plan B:
A break below 5,579.50 would invalidate the IHS setup and likely lead to another leg down, targeting 5,520.
THE AFTERNOON UPDATE
Bears broke under the support 5,579.50 amd triggered a bearish PLAN B for another extension lower:
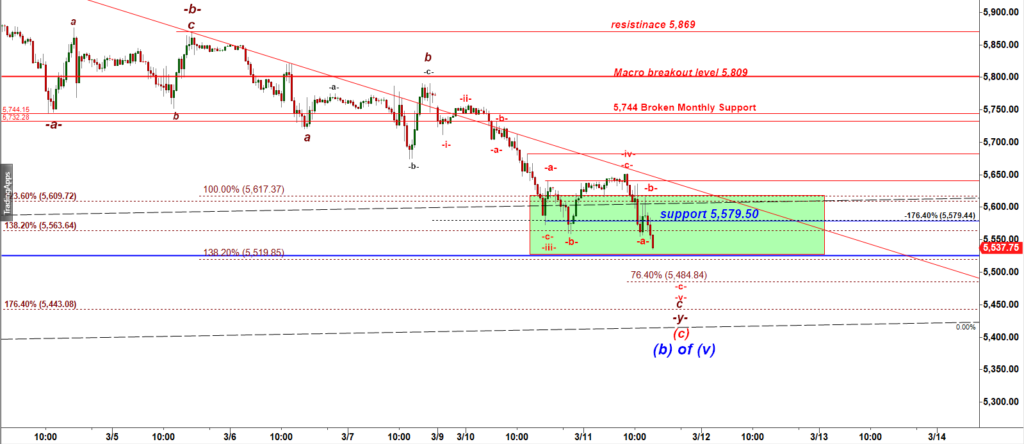
ES-mini 30 min chart
That drop may extend lower down to 5,500 – 5,485.