$ES #ES-mini #Elliott Wave #tradig setup
The bullish wave count tracks this move up as an unfolding five wave up structure targeting 6,300+.
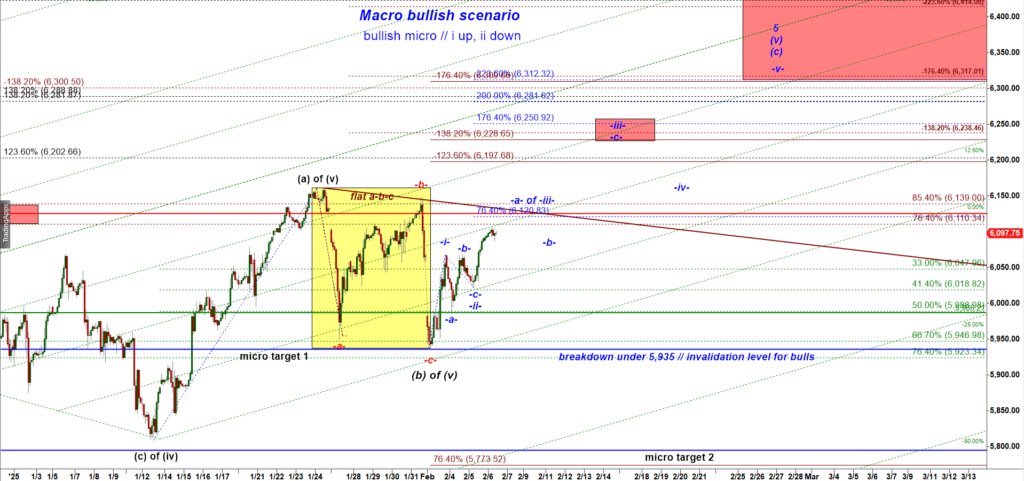
ES-mini 120 min chart
Let’s zoom in to a 15 min chart:
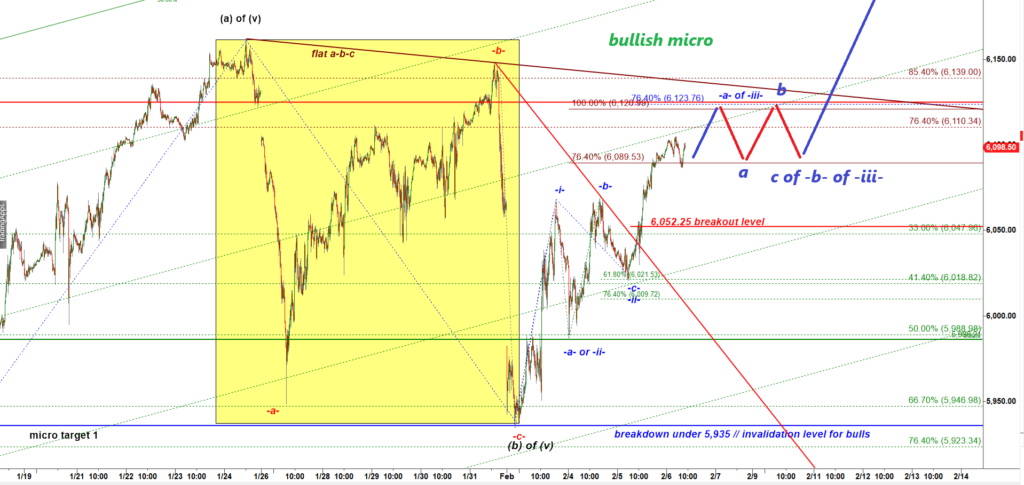
ES-mini 15 min chart
Yesterday we got a long micro -i- up, -ii- dpwn setup, a starting point of a five wave up rally.
We have already got a nice 70 point move up.
Under the bullish setup this rally in the current subwave -a- of wave -iii- up may extend to 6,120 – 6,125 and then produce a flat a-b-c consolidation in subwave -b- down of wave -iii- up. That a-b-c down consolidation should stay withing the range 6,125 – 6,080.
Bearish scenario.
There is a low probability tricky scenario where the -a-b-c- down corrective structure in the yellow rectangle was not a completed corrective -a-b-c- down structure but a part of a larger and trickier Expanding Triangle -a-b-c-d-e- down structure:
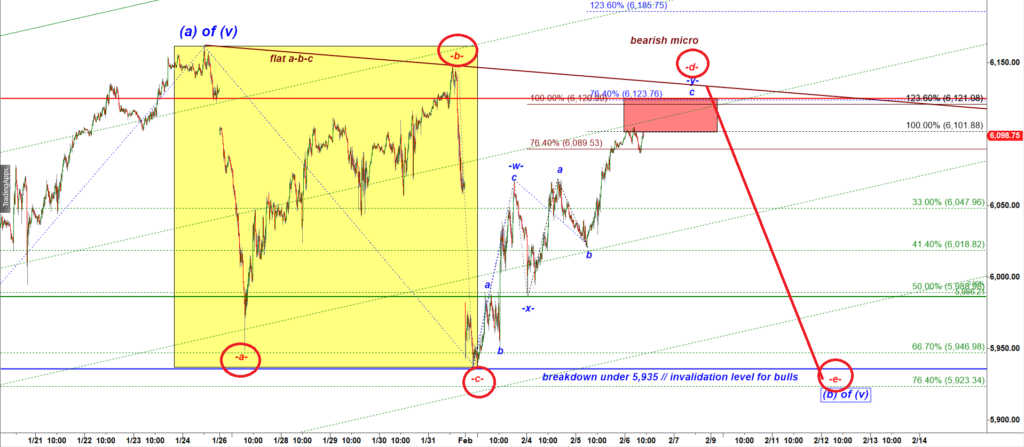
ES-mini 15 min chart
If that is a corrective wave up, then I would count that mpve up as a subwave -d- up of super tricky Expanding Triangle corrective pattern where each subwave is larger than the preceding one.
In that case that rally may extend higher to overshoot the declining red trend line, create a bulls’ trap, and then close a bulls trap pushing ES back under the red trendline and play a very strong panic driven drop back under 5,935 in the final subwave -e- down.
Under that Expanding Triangle pattern each subwave has to be larger than the preceding one. A min 100% ext of the subwave -b- up is located at 6,135. That means taht even under that bearish scenario, this subwave -d- up has to overshoot 6,135 to create a bulls’ trap...