$NDX $NQ
Futures and the underlying cash index often display noticeably different wave structures. The primary reason is that indices are calculated based on regular trading hours, whereas futures trade around the clock and include additional data from overnight sessions.
It’s not always possible to determine which wave count holds greater significance. However, it’s valuable to monitor both, as they can provide complementary insights.
This is how we can count waves in that rally off the last major low made in Oct 2022:
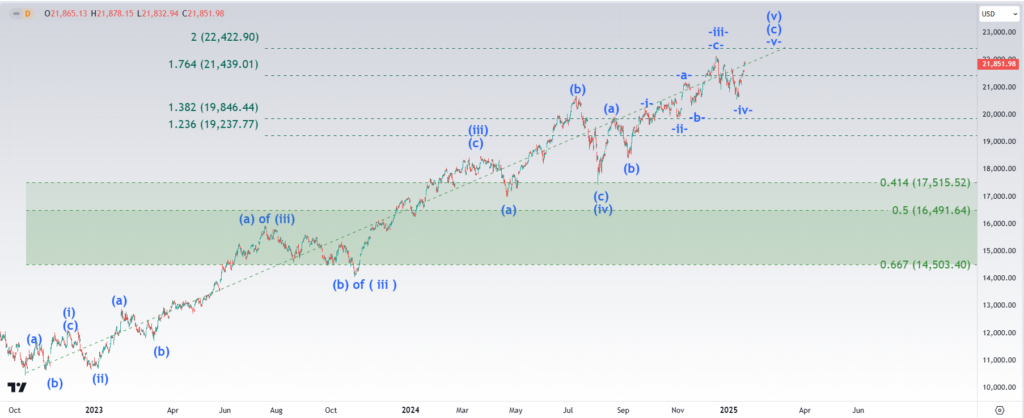
NDX-100, Daily chart
that wave count argues for the top of the rally off the Oct’22 low at 22,422 (cash index, not NQ futures):
NDX-100, Daily chart
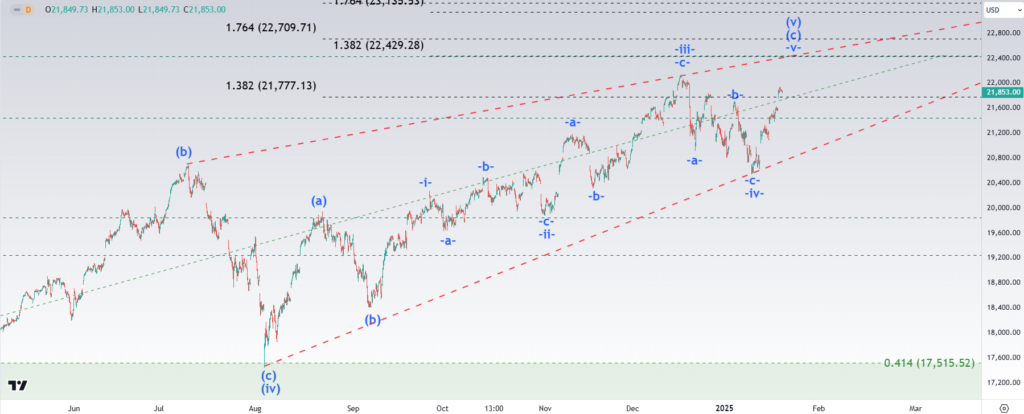
You can open this wave count in Tradingview: link: www.tradingview.com/chart/yk3THeZO/
Upon completion of an impulsive five wave up rally we always expect a corrective a0b0c move down. This correction should first retest the low established by the previous wave (iv) down.