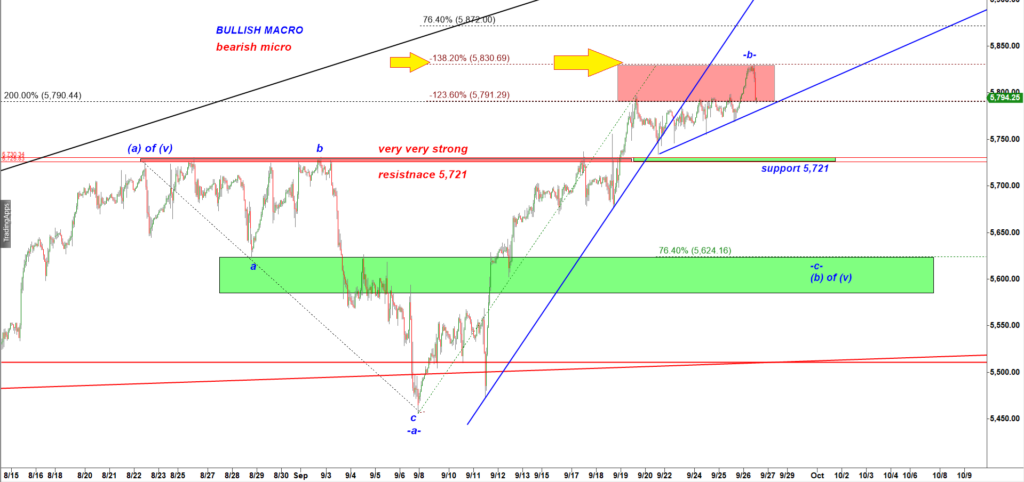
$ES #ES-mini #Elliott Wave #trading setup
In my Sunday update I noted:
“A corrective subwave -b- up often tops out at a negative -138.2% ext of the preceding decline in a subwave -a- down. That fib points to 5,830 as a potential target for that rally in that subwave -b- up. That means as long as bulls hold Es over 5,721 they will remain in control and will be able to test the upper edge of the Red Box.”
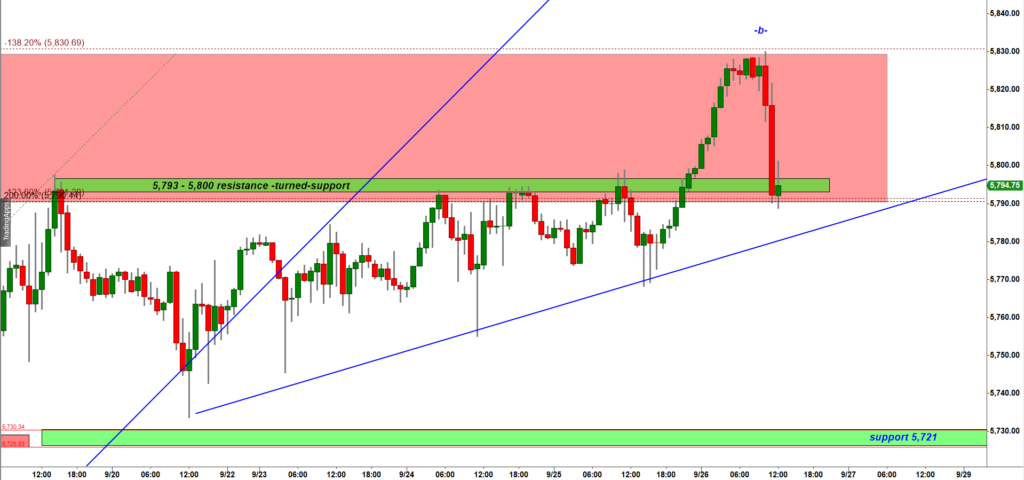
This morning ES-mini has hit the target 5,830:
ES-mini 60 min chart
We see a nice bearish reaction off the 5,830 level. That level is the key resistance of the week.
If bulls break over 5,830 they will trigger the very bullish scenario that allows them to produce a 200 point rally over 6,000.
Under the bearish scenario this decline is a starting subwave -c- down that targets 5,624. To confirm the bearish scenario bears need to break under support of that upward sloped blue trend line:
ES-mini 60 min chart
Let’s look at levels calculated by my proprietary algo Cycle Trader Indicator for TradingView:
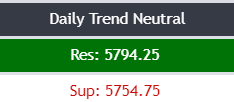
Note that ES came back down to the broken Daily Resistance 5794.25.
The broken resistance in the key trailing support that often gets testes in an up trending market.
Bears need to break under 5,794.25 to confirm change in trend and start of the subwave -c- down.