$ES #ES #trading setup #Elliott Wave
Let’s discuss the short term bearish scenario:
Bears need to pish ES down under 5,721, the breakout line to trigger the short failed breakout setup:
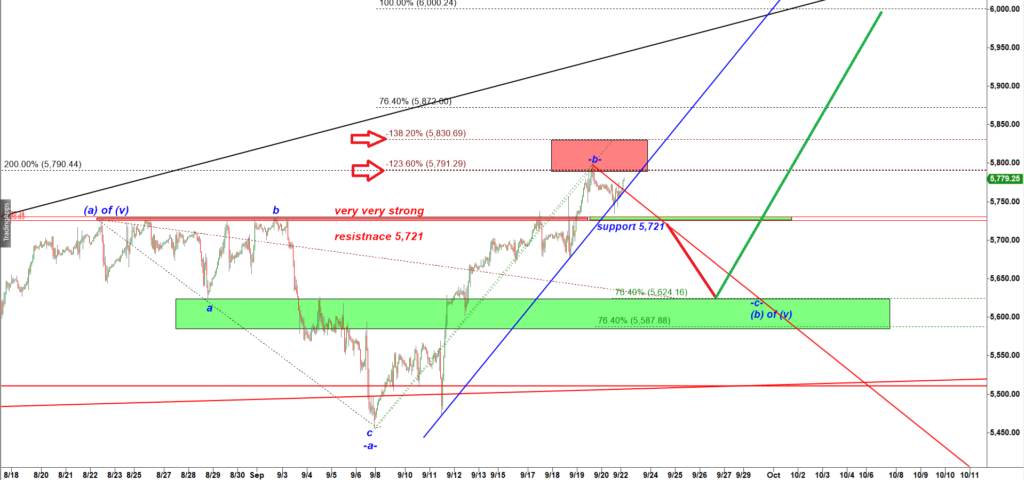
ES-mini 60 min chart
A corrective subwave -b- up often tops out at a negative -138.2% ext of the preceding decline in a subwave -a- down.
That fib points to 5,830 as a potential target for that rally in that subwave -b- up. That means as long as bulls hold Es over 5,721 they will remain in control and will be able to test the upper edge of the Red Box.
The Very Bullish scenario.
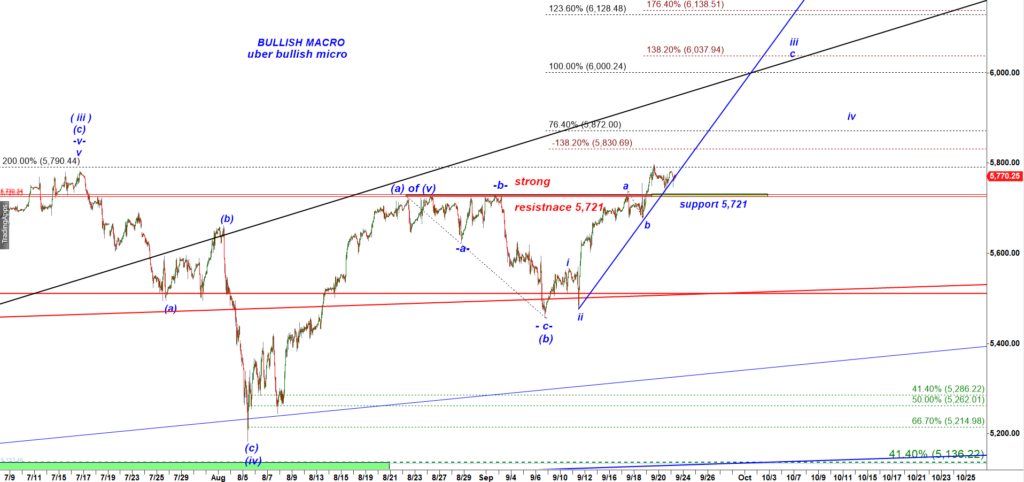
ES-mini 60 min chart
Bears have already tried to break under 5,721 support but failed to break that support.
Failure to break under 5,721 triggers a bullish breakout-n-retest setup for bulls to push ES higher at least to 5,830.
Break over 5,830 would confirm the very bullish scenario.