$ES #ES-mini #Elliott Wave #50% retracement
On Friday morning bulls had a picture perfect bullish reversal setup. But they failed to start a rally. Failure of a long setup was a very bearish trigger that fueled a bearish breakdown scenario:
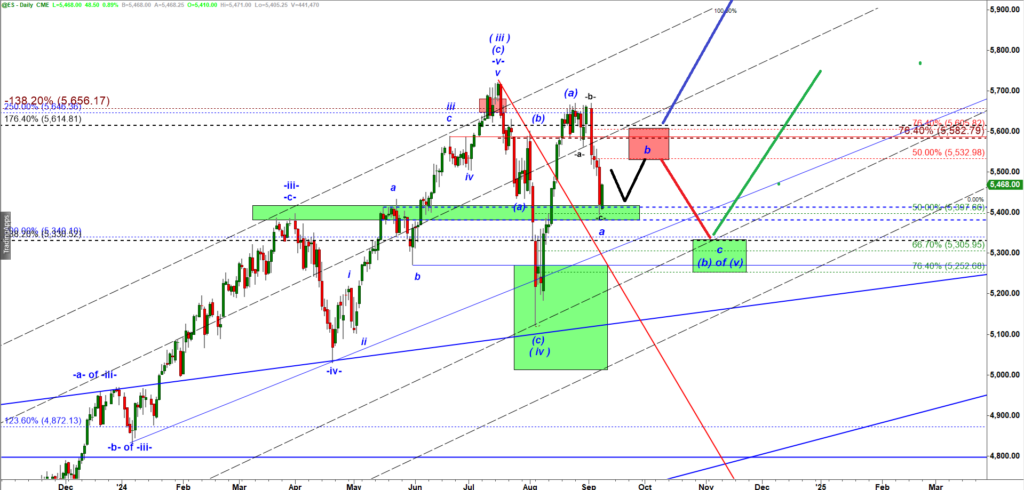
On Friday I noted: “If bulls fail to break over the Red Supply zone and then bears push ES under the overnight low made at 5,466 that will confirm the Bearish scenario. Break under 5,466 will most likely be followed by an accelerated panic drive decline. The next important support will be 5,395, a 50% retracement of the Aug’24 rally.”
ES-mini Daily chart
Bears did exactly what we expected. They broke under 5,466 support and kept pushing ES down the whole Friday afternoon until they hit 5,394.
As you can see, ES dropped down to the Green Demand Zone where price re-tested the high made in March 2024.
My primary scenario is that that early September low was the first leg down in a subwave -a- down and this bounce is part of a corrective a-b-c up bounce in a subwave -b- up. Under that scenario a bounce in a subwave -b- up should be followed by another leg down in a subwave -c- down targeting the lower Green Box.
There is an alternative bullish scenario that argues that the Friday drop was all of the subwave -b- down and this rally is just a beginning of a new leg up in a subwave -c- of wave -v- up targeting 5,950.
The key level of resistance is 5,605. Bulls need to push ES over 5,605 to confirm the bullish scenario.