#NQ $NQ #Elliott Wave #trading setup
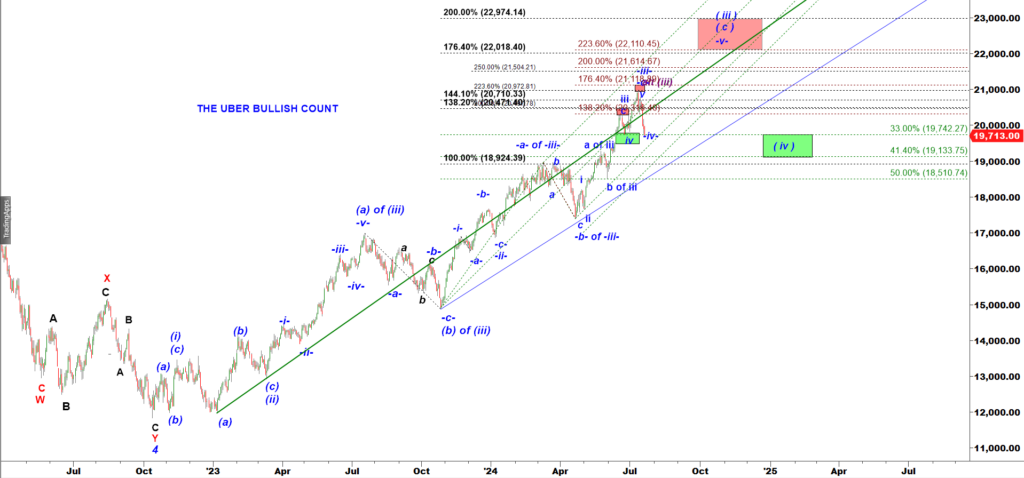
That is my preferred Very Bullish wave count:
Zooming-in:
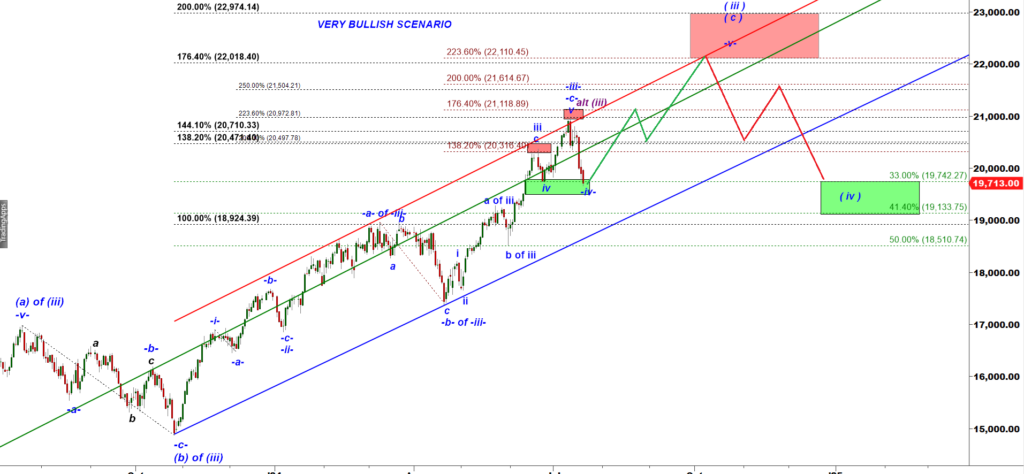
Under the Very Bullish scenario the sharp drop we got last week was a micro wave -iv- down of (c) of wave ( iii ) up.
That wave count allows bulls to produce another leg up targeting 22,000 (the lower edge of the Red Target box).
Note the June low was made at 19,726. That was the low made by a wave iv down of one degree lower.
19,726 is the key level for the upcoming week.
Bears managed to undercut that support. If Bulls manage to reclaim that level and hold NQ-mini over that level that would trigger a tricky failed breakdown scenario. Remember, big moves come from failed moves.
(2) Now I would like to discuss an alternative bearish scenario.
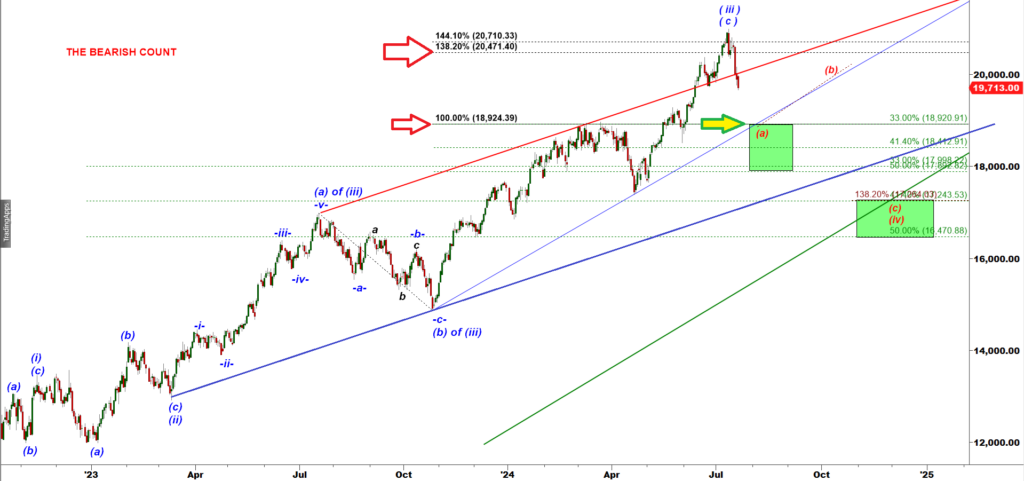
The July rally stopped by slightly overshooting the 138.2% ext of the subwave (a) of wave (iii) up, the textbook target for the subwave (c) of wave (iii) up. I can not find a good micro wave count that would support that bearish scenario. In the majority of cases the second leg up in a subwave (c) of wave (iii) up has a clean five wave up structure. This is why under the bullish wave count we need to get one more push higher. This is why the bearish scenario lacks a clean five wave up structure behind the subwave (c) of wave 9iii) up.
So the bearish scenario is based on assumption that the wave ( iii ) up topped and a large corrective wave ( iv ) down has started.
If bulls fail to reclaim 19,726 level on Sunday – Monday that will open the door for a bigger decline with teh target 1 equal to 19,900, the March 2024 high. And under the bearish scenario that decline woudl only be the first leg down in a subwave (a) of wave ( iv ) down.
Upon completion of the first leg down in a subwave (a) of wave (iv) down I would expect a corrective bounce in a subwave (b) up followed by another leg down in a subwave (c) of wave (iv) down with a preliminary target at 17,370.