$ES #ES-mini #trading setup
The Daily chart has had the Red Box for the major top in between of 5,650 and 5,800:
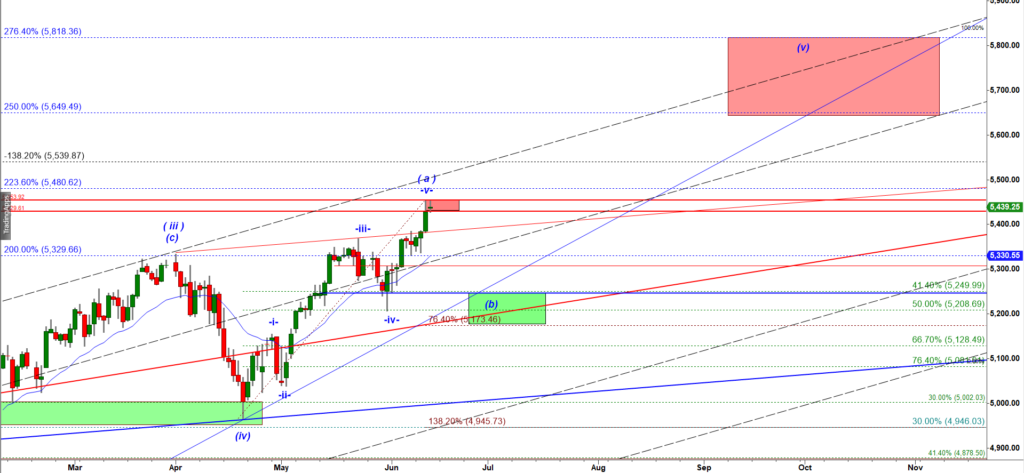
The normal scenario assumes we should get a consolidation in a subwave (b) down of wave (v) up before we can get another leg up to the Red Box. If we look at the 30 min chart we can count the last leg up as a completed five wave up rally:
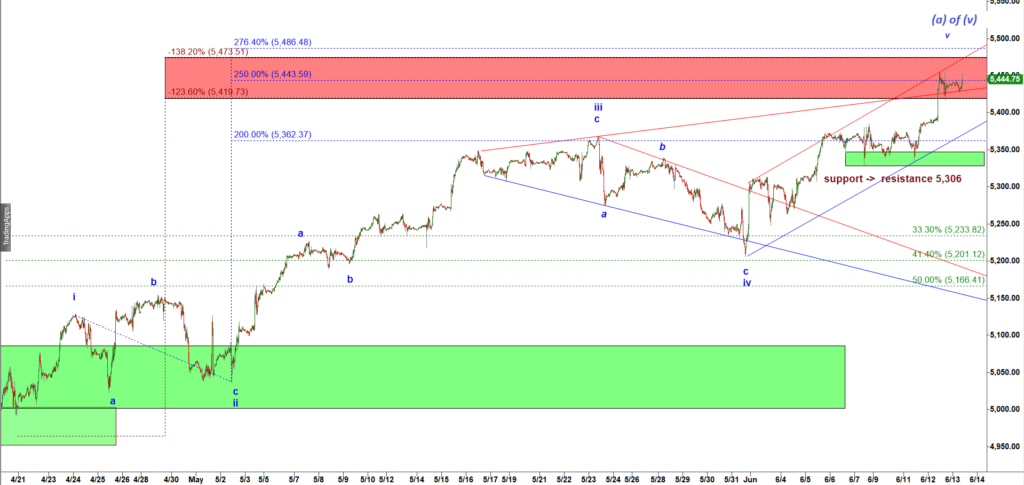
However, If bulls manage to push ES-mini over 5,475 we will have to consider an uber bullish scenario that allows bulls to push higher up to 5,663 and then to 5,789 in accelerated rally of the subwave c of wave iii up. The uber bullish scenario argues bulls can push to the Red Box shown on the first Daily chart above in a direct way.
I like the “normal” path more. It would allow us to go long on an a-b-c down pullback/consolidation shown on the 30 min chart. But quite often the market follows low probability obscure paths. Therefore I would nit short this rally until we see clears signs of rejection off the 5,455 level, the upper edge of the Red Box shown on the micro 30 min chart shown above.