$ES #ES-mini #tradingfutures #Elliott Wave
In the previous update I showed three potential paths for a bearish pullback:
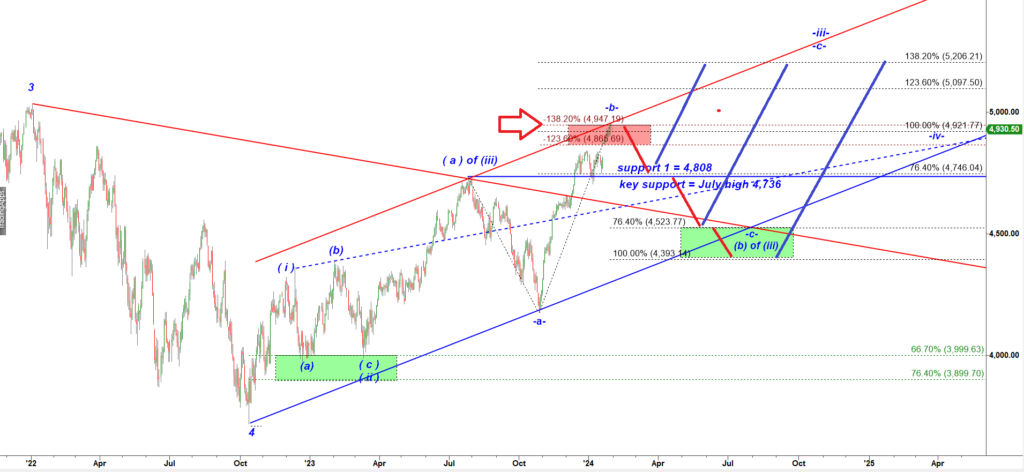
As I noted, “the first support is located at 4,800 – 4,750. Under the most bullish scenario this is where the upcoming pullback may bottom.”
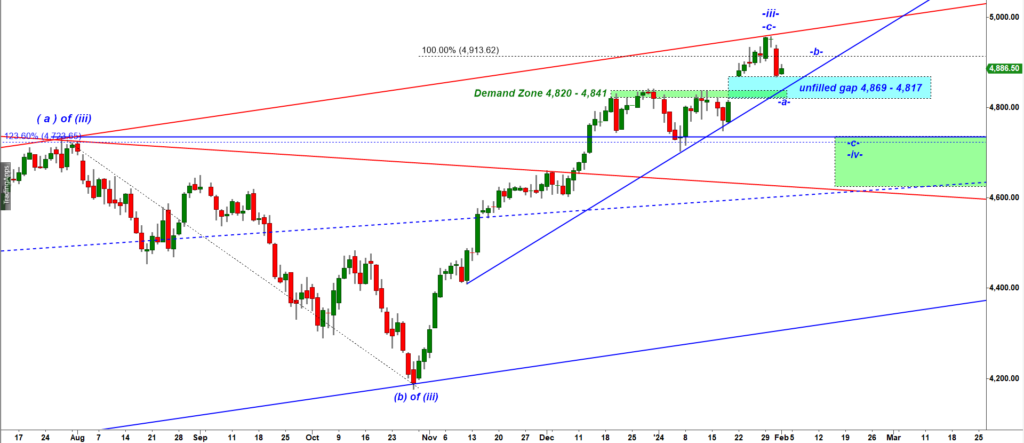
This is how that chart looks like now:
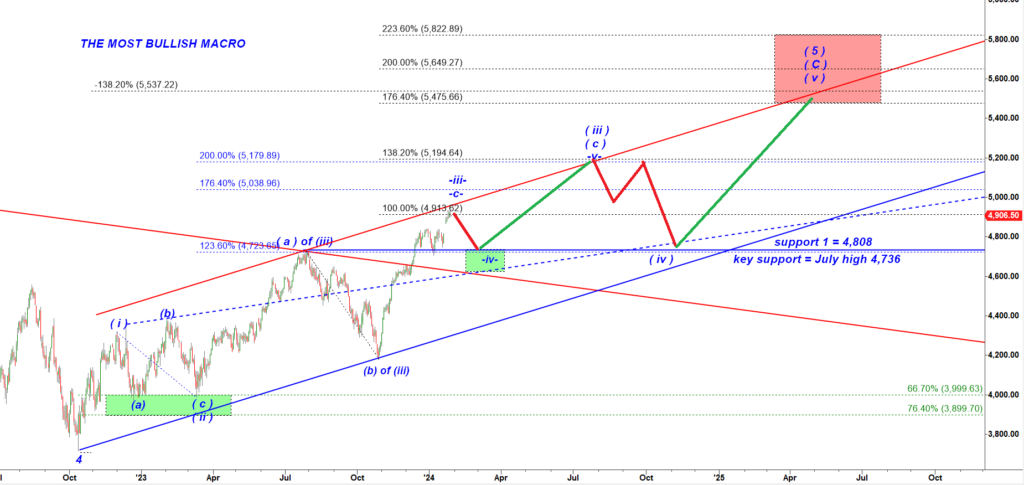
Under the (2) The Most Bullish Macro Scenario price may find support in between 4,800 and 4,750.
The first bullish reaction may be triggered after filling out that cyan gap.
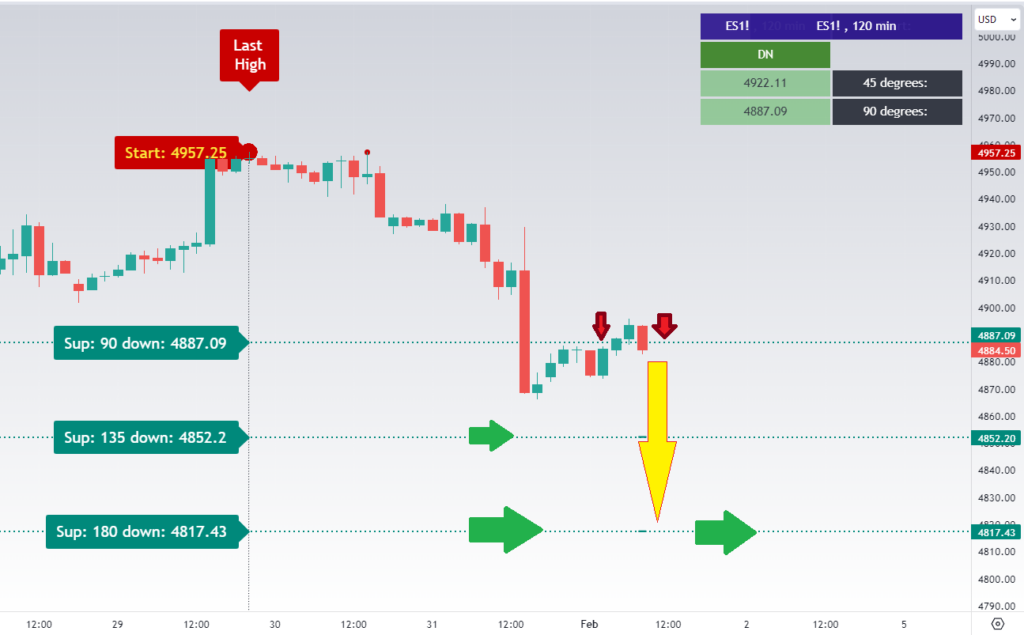
To fill the gap bears need to push ES-mini down to 4,817.
This is how we can count that decline:
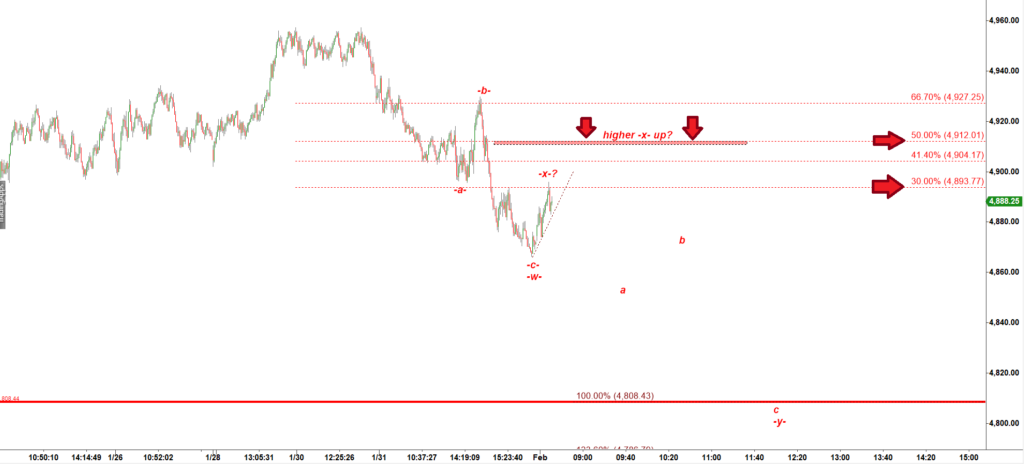
As long as bears hold ES under the 50% retracement 4,921 this bounce could be counted as a wave -x- up to be followed by another a-b-c move down in a wave -y- down:
Interestingly, 4,817 is a strong support at the Gann’s 180 degree level: