$ES #ES-mini #trading setup #trading futures #Elliott Wave
On Thursday last week I posted that path:
ES-mini perfectly followed the path, first dropped into the Green Demand zone and then popped up to 4,800.
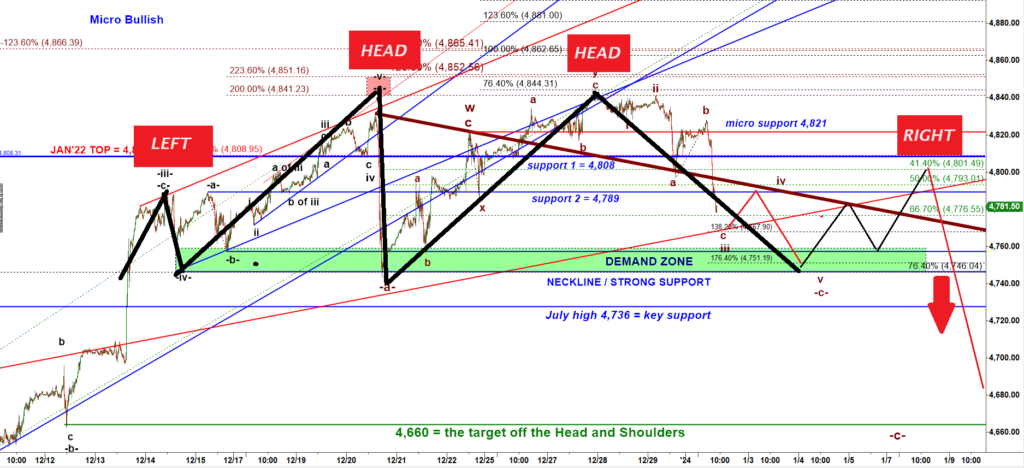
This is how that chart looks like now:
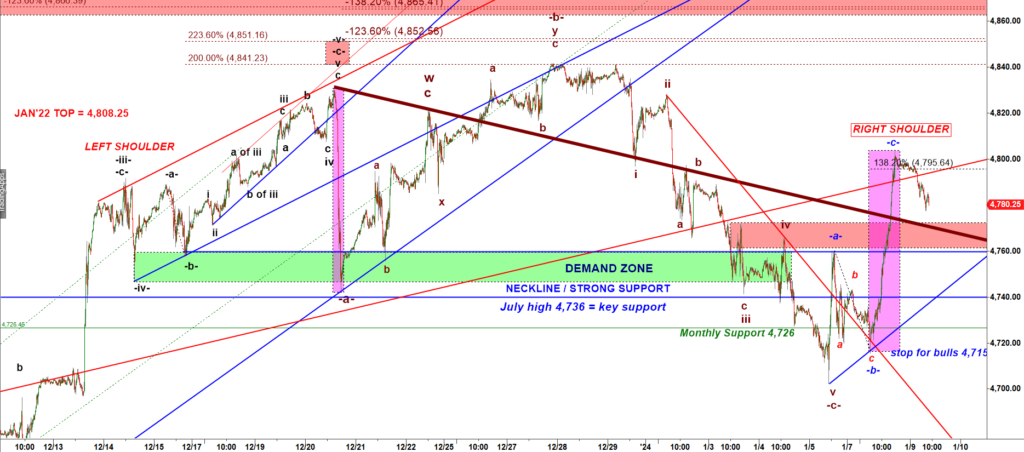
Interestingly, the sharp drop on Dec 21 was equal in size to that structureless rally today (see two purple boxes). Note the sharp drop on Dec 21st did not have any follow through.
Under that wave count the Monday rally could complete the Right Shoulder of the bearish reversal Head and Shoulders setup / pattern. But until bears push ES back under the neckline 4,727 that is just one of many probable scenarios.
We still have two macro paths on the table:
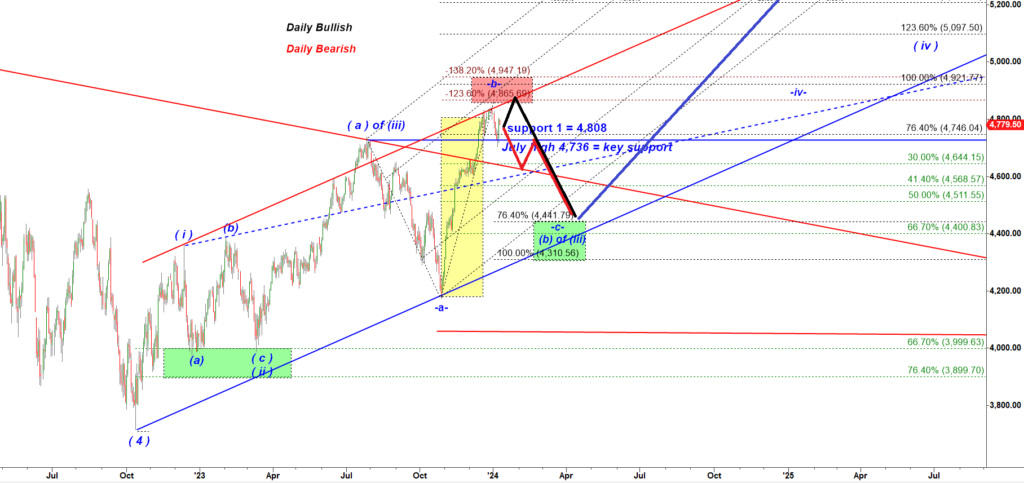
Daily Bullish (black path) allows bulls to push SPX to a higher high, the target is 4,894 (a negative -138.2% of the Jan’24 decline).
The Daily Bearish (the red path) is based on the Head and Shoulders bearish reversal setup (shown above). The bearish path allows bears to push ES down under 4,727 in the second leg down off the late Dec’23 high.