$SPX #SPX #Cycle Analysis
We can identify a 35 year cycle from 1974 low to 2009 low:
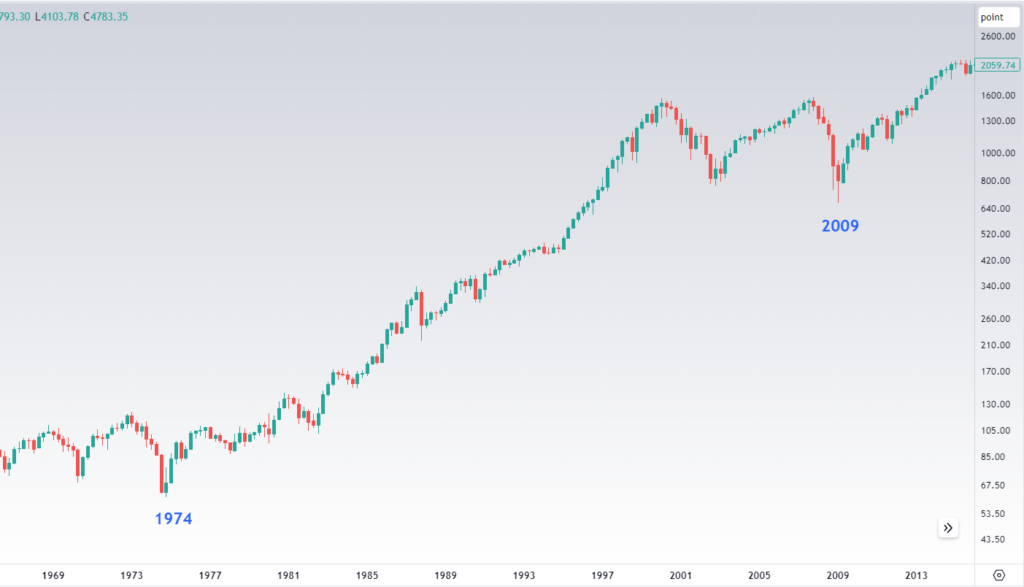
There was a strong drop in 1987, 13 years into the cycle.
If we assume that the same fractal 1974 – 2009 can be applied to the current cycle, the Covid drop in 2019 looked similar to the drop in 1987:
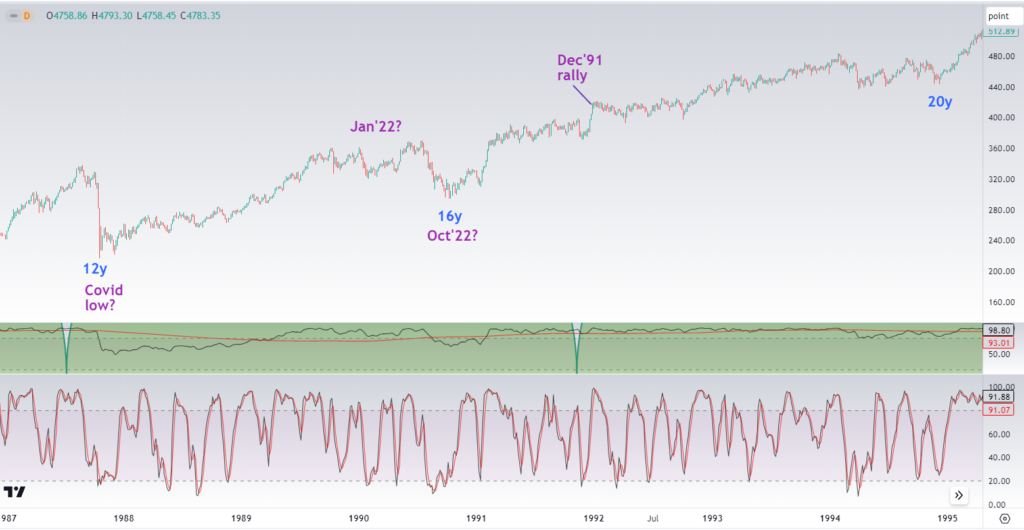
The higher low made in Oct’91 low looks like the low made in Oct 2022.
The rally off the Oct’90 low culminated with acceleration of the rally in Dec’91, 14 months off the low.
The rally off the Oct’22 low is followed by a an acceleration in Dec’23, exactly 14 months after the last Oct’22 low!
This is how the 1992 year looked like:
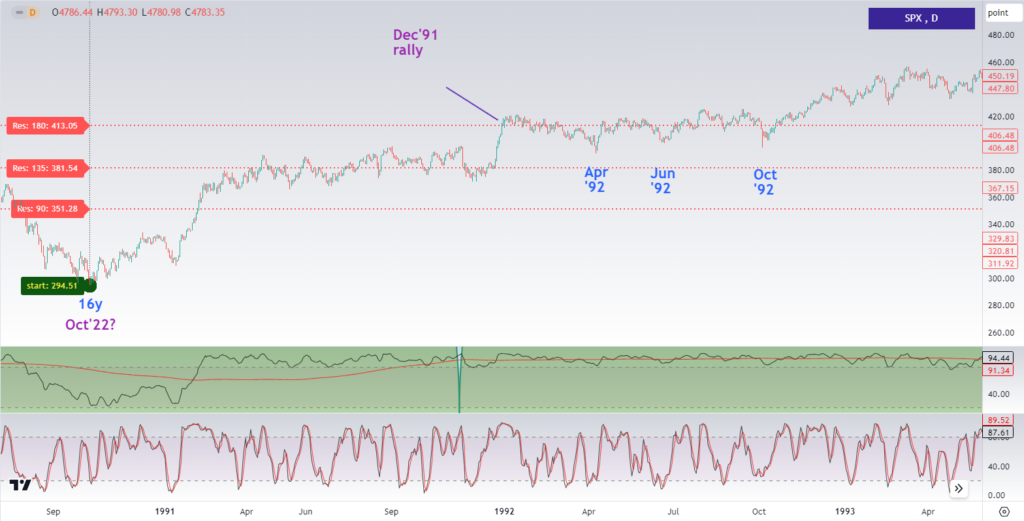
Essentially, it took the market 10 months of 1992 year to digest the strong Dec’91 rally.
Based on those similarities we may assume that 2024 year will be following the 1992 year fractal.
Interestingly that pattern is 100% aligned with the normal seasonality of the election years in the USA:
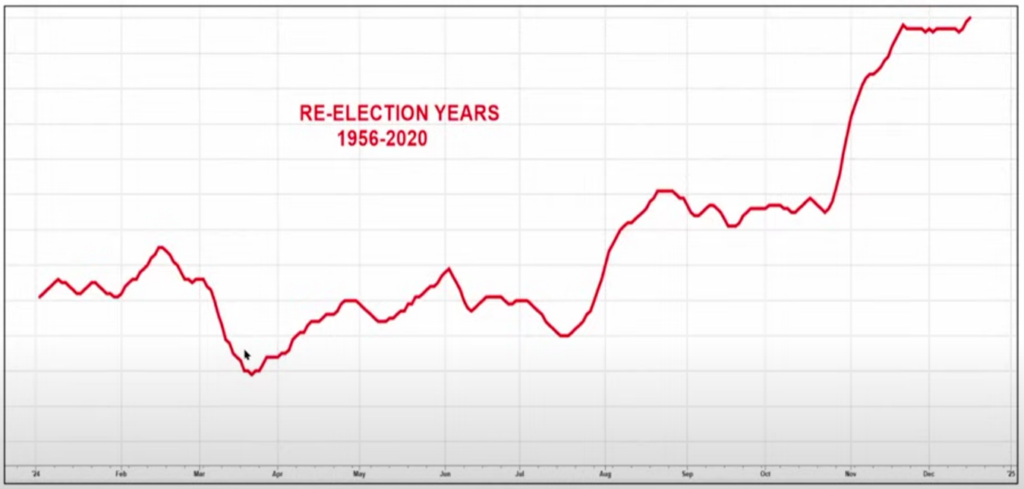
We can see the first buyable low in mid Mar’24.
We can get the second buyable low in mid July’24.
We can get the third buyable low in mid Oct’24.
The next year may culminate with an accelerated rally in December in the same way how the 1992 ended.
One word of caution. You should understand that cycle analysis can hardly predict magnitude of moves. We use cycle analysis to predict timing of major turns, specifically major lows.