$ES #ES-mini #trading setup #Elliott Wave #weekly #macro #Month Opening Range
Last week bulls failed to break over the immediate resistance at 8 EMA weekly (calculated based on highs) = 4,476.50:
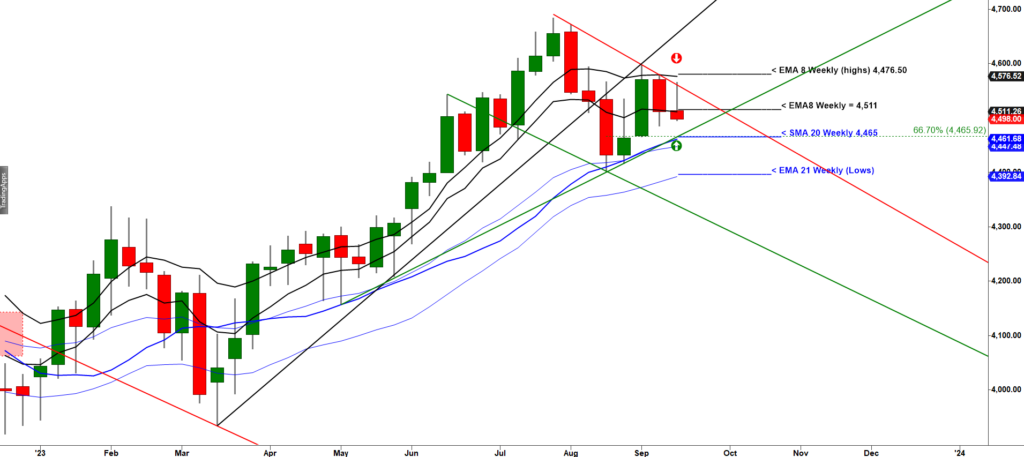
The closest support is 4,461.60 where SMA 20 weekly is located.
In this macro update we will review three scenarios.
(1) The Bullish scenario:
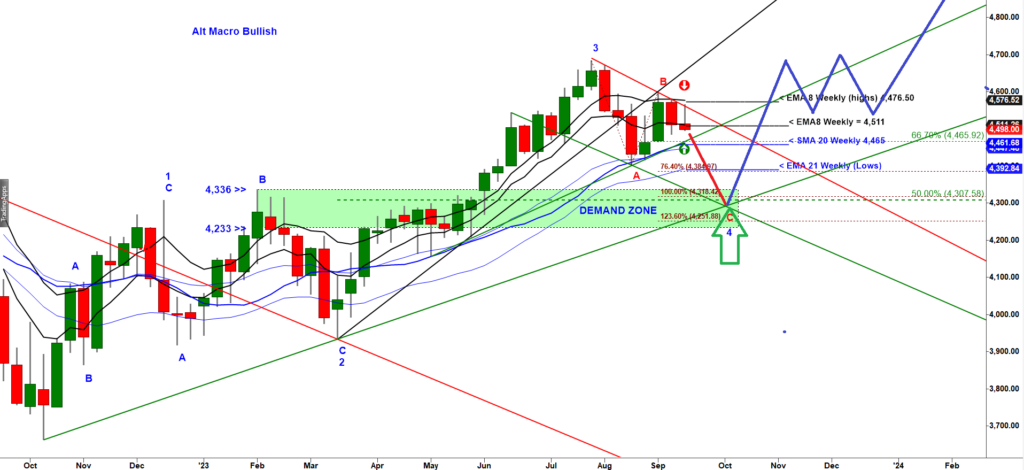
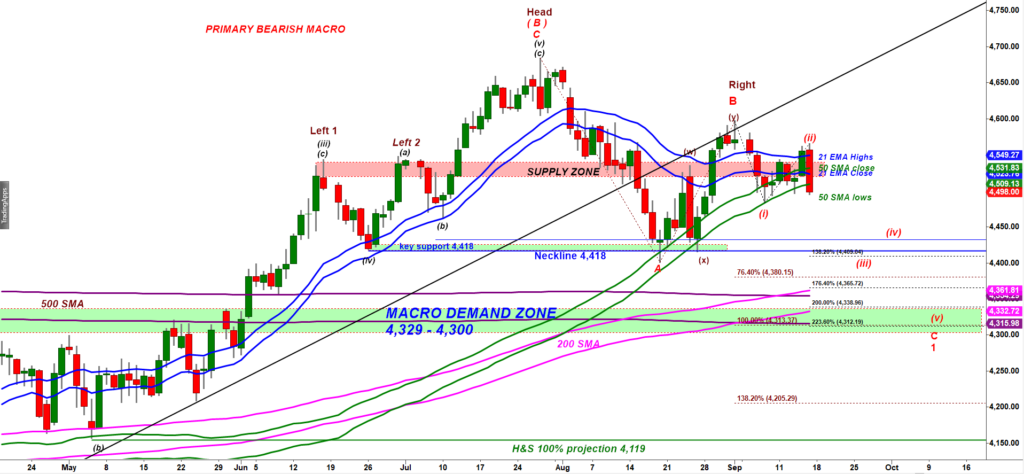
The bullish scenario (1) allows bears to keep pushing ES-mini down to the Green Demand zone (4,336 – 4,233).
The bearish scenario (2) allows bears to push ES-mini much lower, down to the lower edge of that same green demand zone:
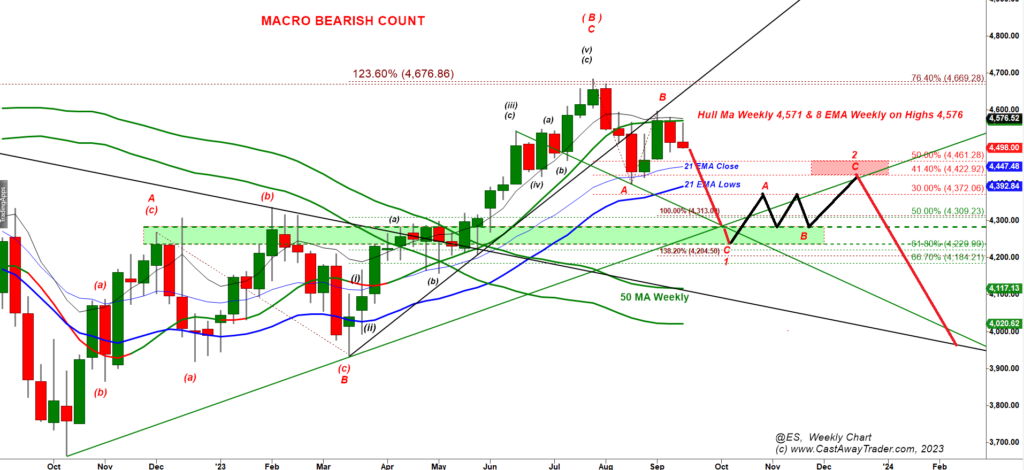
In conclusion: Both most probable macro scenarios allow bears to test a strong support zone 4,310 – 4,230.
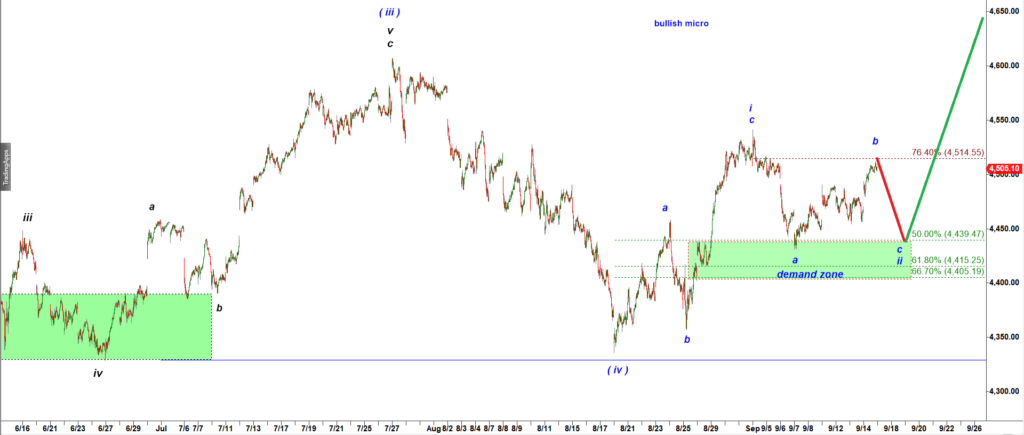
Once price tags the green macro demand zone there are two alternative ways how price can react:
(i) in the bullish scenario price shoudl start a new five wave up move that should push ES quickly back to the July high, or
(ii) in the bearish scenario price should produce a corrective looking A up, B down, C up structure and erase not more than 50% of the decline off the July 23 high.
For large swings we look at two Gann’s projections, down 180 degrees and down 360 degrees:
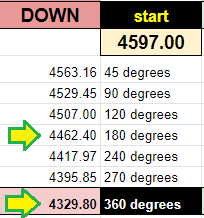
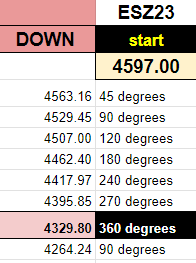
Those two Gann’s projections confirm the Green Demand zone = 4,329 – 4,264.
Read more about Gann’s projections.
Now lets zoom-in to a daily chart:
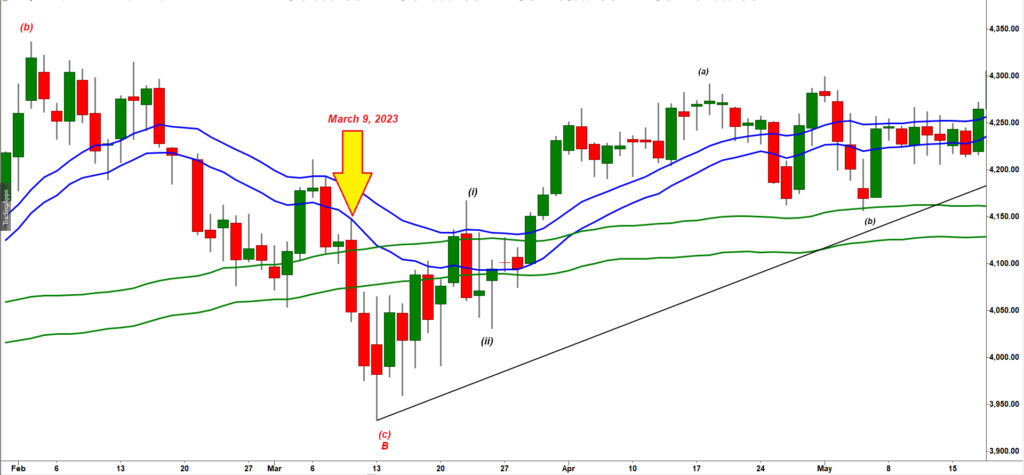
Bears achieved a big win on Friday, they managed to close ES-mini under the 50 Day Moving average!
Last time that happened on March 9, 2023:
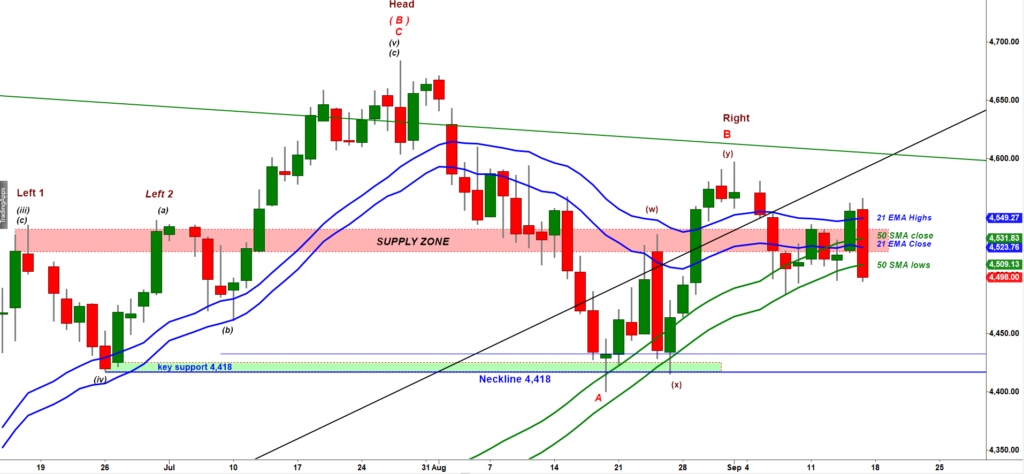
Below is the most important chart in this update:
We can make numerous important observations based onthat chart:
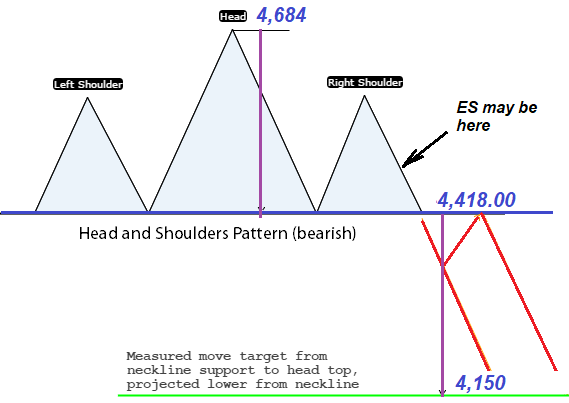
(ii) the next strong support is the neckline of the H&S pattern located at 4,418. That level has already produced a strong bounce therefore I think bears can break under that support this time.
By the way, 4,395 is a Gann’s 270 degrees down off the last high made at 4,597.
the textbook path would argue for a break under 4,418 for 20-30 points to run all protective stops left by retail traders. Note that 4,380 is a meaningful 76.4% ext of the wave A down. That is a very strong support. Therefore, I would expect a big bounce or lengthy consolidation at that level.
(iii) A really strong macro support is located around 4,300. If bears manage to break under the 76.4% ext = 4,380 the next target for another push down would be 100% ext of the wave A down = 4,313.
The very same logic applies to the Gann’s levels:
A strong support is located at 270 degrees down = 4,395. Break under that level would open the door to test the next strong support at 360 degrees down = 4,330.
Now I would like to discuss the very bullish scenario No.3. The Friday drop was a strong argument in favor of the bearish scenario but it was not big and strong enough to break the bull’s neck.
(3) Low Probability very bullish scenario.
On Thursday I noted that S&P cash chart argued for a drop:
Let’s check how it looks like now after the Friday drop:
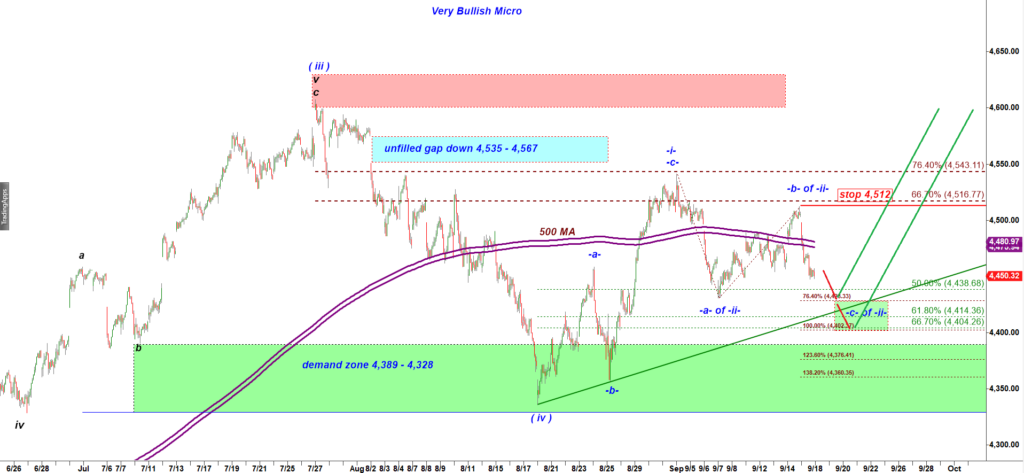
At this moment this is a feasible scenario without flaws and to invalidate that bears need to keep pushing ES down slicing through 4,400 level. If this decline suddenly lost momentum in the upper green box that would be the first warning for bears.
 A break back over the stop 4,512 would most likely solidly invalidate any bearish scenario we discussed in this update!
BONUS:
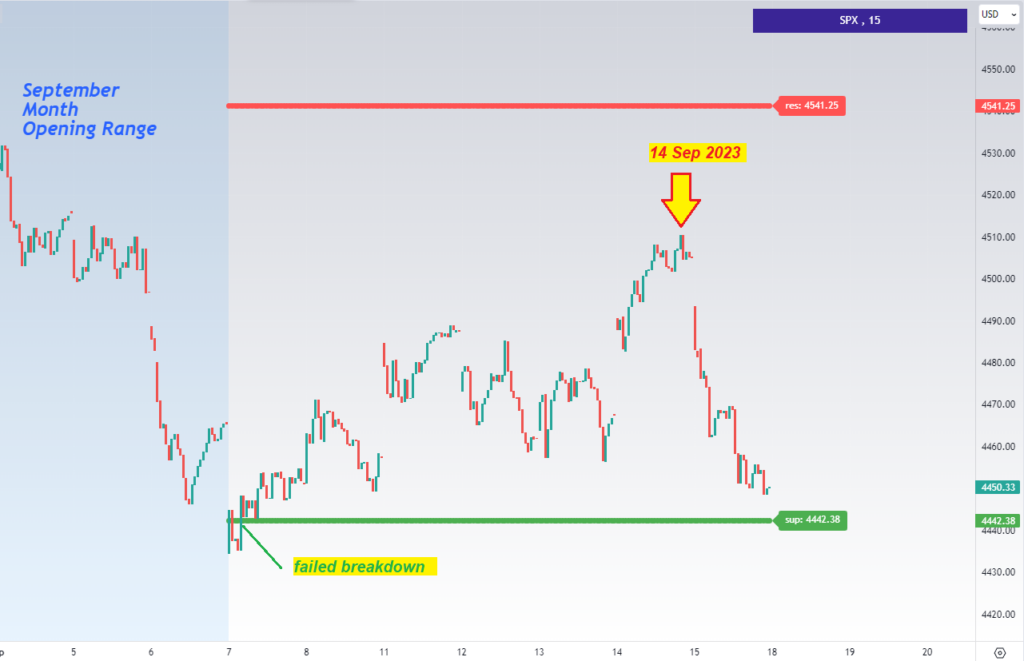
Update of the MONTH OPENING RANGE STRATEGY.
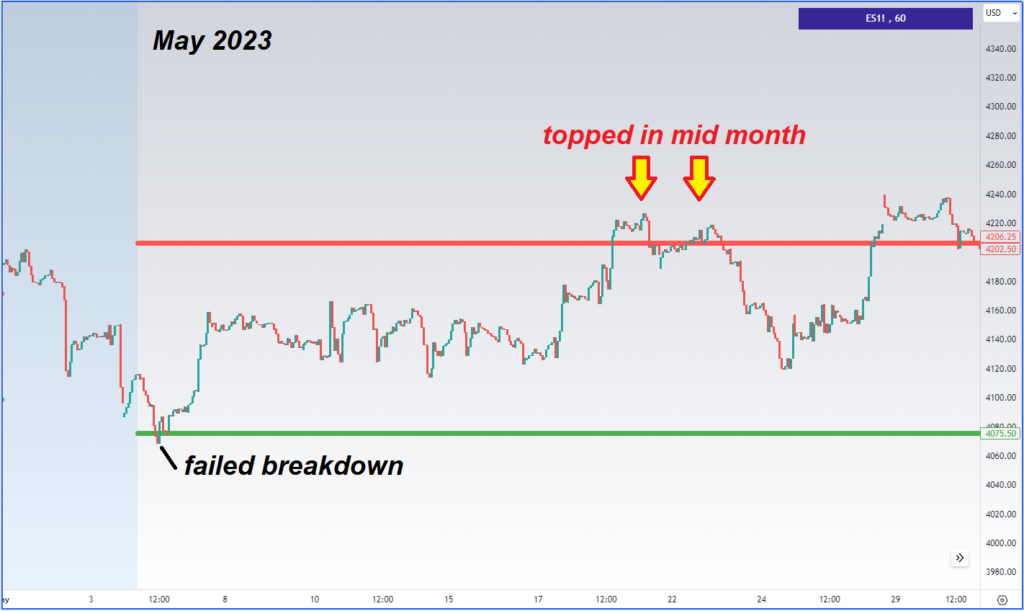
According to the Month Opening Range strategy when bears fail to break under the Monthly Support during the first week of a month we normally get a reactive rally targeting the Monthly Resistance, the highest point reached by the price during the first full three trading days of a month:
When price tops out in mid month it tends to spend the following week to decline back down to the Monthly Support:
Another example showing the same pattern:
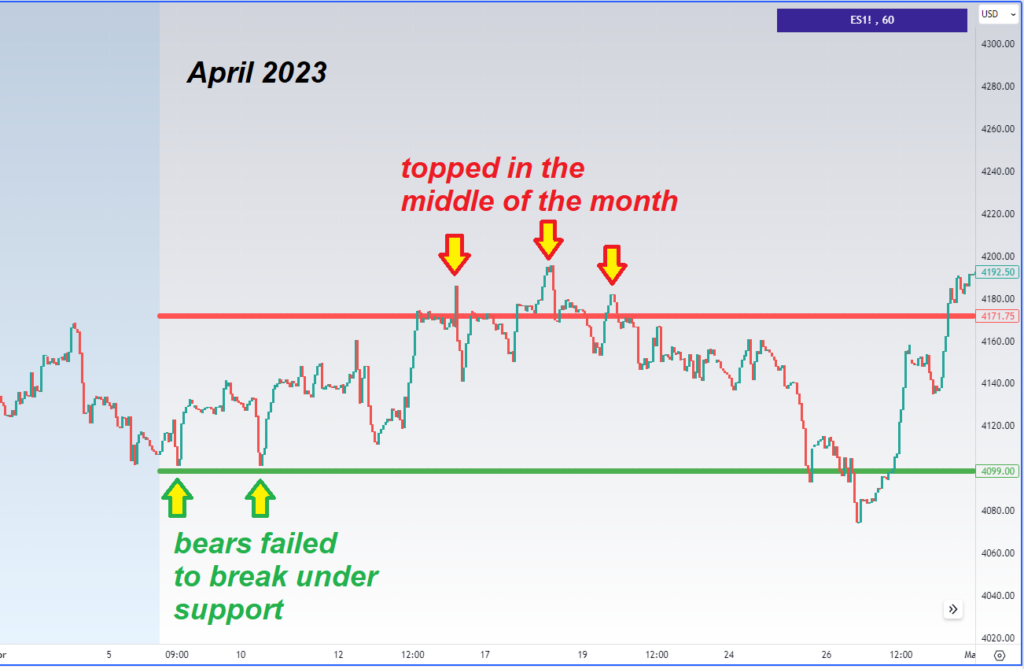
I would note that in May’23 and April’23 price managed to hit the red monthly resistance before turning down.
In Sep’23 bulls were much weaker. They failed to hit the monthly resistance 4,541.25 for SPX (4,597.25 for ES-mini).
From the perspective of the Month Opening range strategy SPX/ES is approaching the most important level of support, the Monthly support standing at 4,442.38 for SPX and 4,448.75 for ES-mini.
There can be no guarantee bears actually manage to break under that Monthly support.
Look again at the April and May charts shown above. They show the same pattern. A decline bottomed around 24th – 26th of a month, then bulls stepped in and strongly pushed ES up back to the Monthly Resistance! That repeating pattern actually supports the (3) Very Bullish scenario!
Conclusion: break under the Monthly support 4,448.75 should be followed by a decline down to the “neckline” at 4,418.